
EXECUTIVE SUMMARY: This is the first in a new series of articles discussing the performance of six concepts/indicators to implement marketing plans with a goal of maximizing net price over time while managing price risk. The new series evaluates “true hedge” plans primarily designed for forward cash contracting, where sales contracts will NOT be lifted, in contrast to multiple hedging plans where contracts can be lifted or offset to protect the hedging gain. The primary goal of this series of studies is to identify marketing plans which have generated the highest net average price most consistently over multiple years and marketing conditions. A secondary goal is to answer nagging questions about why some marketing plans don’t seem to be producing the desired or expected results.
Marketing plans for six individual concepts/indicators have been evaluated with a standard format to summarize nine levels of parameters for each indicator. Each futures contract produces 54 market plan reports (six indicators with nine parameter levels each). The multiple hedging research focused on both harvest and post-harvest delivery for corn, soybeans, and wheat. The true hedge (cash contract) research now incorporates a specific number of planned sales to be achieved before harvest delivery so each article will be limited to the results for the 54 plans for harvest delivery.
The basic engine for the new research uses an expanded Excel workbook format (20-30 sheets) with macros patterned after templates developed for the earlier research to evaluate multiple hedging performance. The new templates retain the format using the last 300 days of futures contracts but have been updated to summarize data for 2009-2018. The accounting format for hedging gains or losses against the benchmark of contract closing prices has been retained. A section was added to monitor planned and actual sales and to account for disposal of residual inventory which has not been priced by harvest time.
New decision rules were written to simulate sales decisions for each of six indicator groups. The selected indicators include: 1) price targets/cost-of-production, 2) cycles/rallies, 3) moving averages, 4) moving average convergence, 5) moving average divergence, and 6) stochastics. The new templates also incorporate flexibility: 1) to evaluate multiple levels of targets for each indicator, 2) to incorporate local basis estimates for conversion to localized cash prices, 3) to set the number of planned sales, 4) to set a basic price goal, 5) to set add-on profit goals above basic production costs, and 6) to incorporate fees for HTA and basis contracts if utilized. With this flexibility, the number of marketing plans that can be evaluated is an exponential expansion of the 54 core plans.
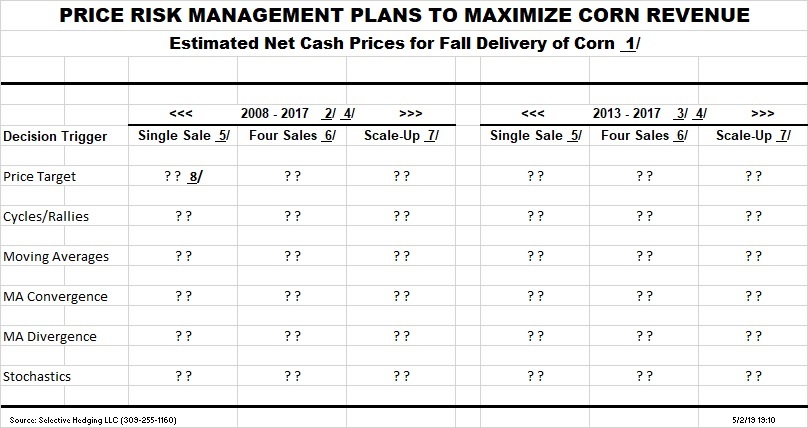
Where are the numbers? The table is not very useful without performance data. Let’s cut to the bottom line. Where is the performance data documenting how various marketing plans work over time? How can an effective risk management plan be implemented without knowing how different plans perform? Data will be generated for each cell in the table as new articles are posted. You will be surprised and enlightened with the performance of each indicator over multiple time periods and multiple variations of the marketing plans.
The primary goal of this series of studies is to identify marketing plans which have generated the highest net average price most consistently over multiple years and marketing conditions. A secondary goal is to answer nagging questions about why some marketing plans don’t seem to be producing the desired or expected results.
Posted by Keith D. Rogers on 16 May 2019


