
On 16 Sept 2023, I understand that yield and price are high priority on many farmers’ minds right now. The crop is made, but still not measured across the scales, so the last chance to increase the revenue is a better price. According to many farmers, the simple and popular answer to volatility is speculators and fund managers, and maybe even the government, are manipulating the markets.
Indeed, all of those players have some effect on the market prices. Speculators and fund managers are in the market to “buy low and sell high,” or vice versa, and make a profit. They do not care whether the price is high or low, so you do not need to look farther for their motives. The government, through USDA, has responsibility for many functions in agriculture, but monthly reporting of U.S. and world Supply and Demand estimates is the one most farmers focus on throughout the year. USDA’s responsibility is to present the most accurate estimates possible for the end of marketing year balance sheet using multiple sources, technology, and statistical estimates. The fact that the USDA estimates do not match those of farmer “experts” does not prove either bias or intent to manipulate the markets. It could be they are just doing their job as laid out in standard procedures developed over many years. In the end, the markets decide which numbers are most accurate, and all farmers are free to use them or not.
If you want to believe volatility and low prices are about conspiracy and manipulation, I can’t help you. What I can do is share some of the economic and statistical logic that explains a major portion of the volatility. Think about the S&D framework. We still don’t have an acceptable consensus number for the 2023 crop production, and we apparently don’t have demand functions for either domestic use or exports. It is not necessary to look any farther for an explanation for volatility. It is not a mystery or manipulation; it is the markets adjusting to new and conflicting information on a daily and weekly basis until we do have firm estimates for carryout.
Let’s take a good look at the WASDE reports and isolate potential sources of errors. There are 14 or 15 lines in the reports, and they are all best “statistical” estimates at a point in time for a balance sheet at the end of the marketing year. NOT ONE LINE is known for certain, even when the reports say “final.” What does that mean?
Let’s back up further. The reports have two basic goals – - to estimate Ending Stocks (ES) which will be left at the end of the marketing year, and the price equilibrium value that will be established by the markets. ES is normally determined by simply subtracting Use from Total Supply. Therefore, if there is an error in any of the lines used to calculate Supply or Use, the errors feed into the ES estimate. The conclusion is straight forward that the ES number is likely the least accurate line in the report because it has the most cumulative errors. No manipulation here; just how the numbers are generated.
Next, how are the price estimates generated? Traditionally, market analysts take a short cut and calculate Stock:Use ratios to project price change expectations because there is an economical logic. The accuracy of this short cut depends on the accuracy of the Supply and Use estimates and many assumptions about variables which are buried out of sight in the estimates of the 10 or 11 lines going into the calculation. By default, price appears to become a projection of previous price patterns and NOT an equilibrium calculation for Supply and Use.
If so, it appears to be glaring violations of basic economics principles. Price discovery equilibrium can be written in a simplified version as a series of three equations. S=f(P,x,y,z), D=f(P,a,b,c), and S=D where the quantity supplied is a function of Price and other factors, quantity demanded is function of Price and other factors, and Supply equals Demand at a specific price. Graphically, the equilibrium at a specific price looks like this sample.
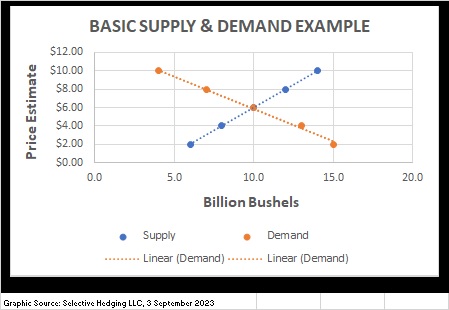 In reality, the first short cut is taken when Planted Acres, Harvested Acres, Yield, Beginning Stocks, and Imports appear to be projections of previous trends that are only loosely related to price, or not related at all. In short the supply estimate becomes a quantity number and not a function of price so that the actual representation of a Supply Curve is often a vertical or near vertical line, on the graph.
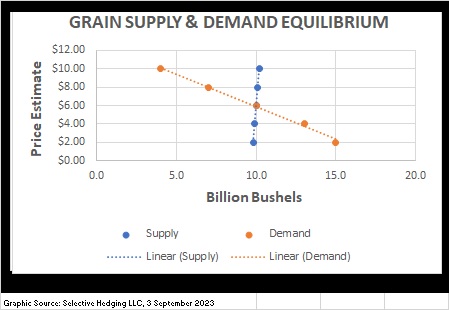
The potential price estimate errors begin to compound. Supply includes Beginning Stocks (BS) and later Use will include ES. Stop and ask yourself why anyone was holding any stocks at the end of last marketing year and why will there be ES at the end of this marketing year. There are many reasons farmers hold stocks during or at the end of the marketing year, but it usually is because they believe the price will rally. By definition, that makes BS and ES both a function of price. By calculating stocks as a residual (subtraction) in the report, it is implied that they are not a function of price. By default, that calculation alone can introduce an error in the area of 5-10% of Supply even if the calculation has a very small confidence interval. Simply said, if equilibrium price is not used to determine the Supply components, then a second major source of volatility is introduced.
The most glaring error shows up on the Demand side. Specifically, everyone who has had Econ 101 knows how significant the demand curve is in determining price equilibrium. I am going to step on some toes, but to the best of my knowledge, no one has ever seen a demand curve for corn or soybeans! If that is true, every line in the Use section is a projection of some trend and not a function of price or price equilibrium at all. The potential error is huge.
I can’t say if the folks who produce the price estimates for USDA do or don’t use an equilibrium model or even have basic demand curves, but I can point to some things that suggest we don’t know what the soybean demand curves look like. Back to basics. If the price is determined by an S&D equilibrium model, and Supply is assumed to be a function of price, then it follows that every price reported in the WASDE reports is the intersection of the Supply with the implied demand curve. Domestic demand curves are very stable over time with a bias to shift right as the number of consumers increase over time. Thus, it should be very easy to construct a proxy demand curve from the WASDE reports. In theory, the reported price points are the intersection of the Demand function which is price sensitive with the Supply function that is not price sensitive so the monthly price points should all be along a single function that traces out the demand curve. We know the demand curve is not linear so that it flattens out at low prices and high quantity and turns up sharply at high prices and low quantities. Regardless of the precise functional relationship with price, we know that demand theory says the demand function should be downward sloping from the upper left corner of S&D chart to the lower right corner.
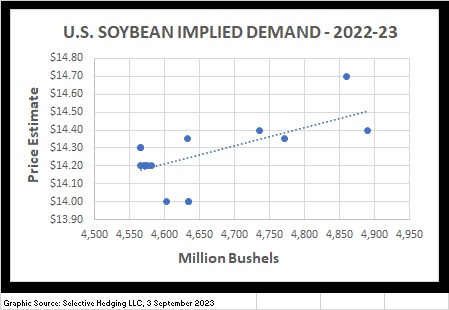
Look carefully at the chart for the 2022 soybean crop with the USDA prices graphically presented from the preliminary estimate in April 2022 through August 2023. The chart violates two major economic assumptions. It does not conform to a systematic functional form and the regression is upward sloping rather than downward.
This is not meant to say that USDA is using inappropriate price estimation methodology. It is meant to point out a major source of volatility if the true demand estimates are not consistent. The only line in the Use section that is normally subject to major demand changes is Exports. The demand function for exports is a composite of the demand curves for all countries using soybeans. The quantity demanded for U.S. exports slides up and down the U.S. demand curve as well as the demand curve of each country all the time just like quantity of soybeans used domestically, but there is a whole new set of factors that can shift the entire demand curve for exports over very short periods. Once domestic Supply and Use have been determined, the major source of volatility is a shift in export demand and the direct impact on ES and Price.
Volatility is about the unknown and rumors about the unknown future. Regretfully, farmers will never have all the information about the future between harvest and the time they have to convert the crops to cash flow. Being integrally involved in world markets as our grain markets are, means marketing decisions will always have to be made within a context of even less stability than our own domestic markets.
Posted by Keith D. Rogers on 16 September 2023


