
Crisis decision time. The markets are moving. What shall we do? This is not when most farmers want to stop to study what is really happening, but it is an incredible learning opportunity. I am not here to rain on any party or beat up anyone who already has lost a lot of money. I am going to take a shot at talking about what information is available on the charts for anyone who is interested in reading these comments now or storing them away for later.
The charts I am talking about are pure and simply the printed record of daily trades. Because I think moving averages are easy to understand, have certain mathematical characteristics that make them easy to work with and mine information, and because several posts have recently been about MA indicators, I will try to address the good, bad, and ugly as unbiased as I can.
The first glance at the charts clearly indicates that we have a short term bottom in corn, beans, and wheat. The question is how short is short or how much higher will the market go? To keep the discussion focused, I am going to use CN24 as an example. I have three MAs (5, 17, & 35) added to my data chart.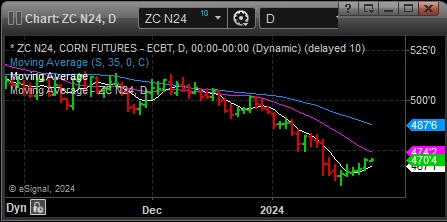
The reason that this is a great learning opportunity is because it is decision time – time to lift or offset hedges if the market is going to rally, or put protection in place if the market is going lower. Getting that call right is the single most cost effective decision any farmer can make. And it is the decision that every farmer can make in a few seconds. Through last Friday, it was absolutely clear that the long term trend was down. How can you reach that conclusion? When the price is less than MA5, MA5 is below MA17, and MA17 is below MA35, that is the condition the defines a sustained downward trend. To have a sustained rally, Price will have to get above MA5, MA5 above MA17, and MA17 above MA35. Just look at other areas of charts and look closely at the relative position of those variables while a rally was on or when the rally turned down. By logical deduction, the price and averages have to converge on each other at both the top and bottom of sustained market moves. Repeat, the condition of a sustained rally did not exist last Friday. This process repeats itself regardless of the price or time because it is a mathematical identity and not some made up marketing opinion.
Since Friday, prices have climbed above MA5, and that will happen with every internal short term correction and every major trend change. So, which is this? You can draw your own conclusions but here are some statistics to consider. For the last 300 days of the last ten CN charts, Price has crossed MA5 742 times (74 times a year), which resulted in 246 winning transactions, and 496 losing transactions. Seven of the years ended with transaction losses, and three with transaction gains, and an average loss over the 10 years of about $0.38 per bushel. Now the truly ugly, one year ended with a loss of $1.75/bu. and another $1.45/bu. Using price crossing MA35 as an entry and exit, there were 123 transactions in 10 years, 35 winners, and 88 losers. The average annual transaction gain was $0.41/bu. with four of the 10 years failing to produce a positive gain.
What other secrets is the chart hiding? On Friday, it was possible to calculate the price would have to close above 468.25 to turn MA5 up Monday, and above 498 to turn MA17 up, and above 504 to turn up MA35. As long as MA17 and MA35 are diverging, no sustained rally has been confirmed. Drop down to the hourly chart, and have a look at a sustained rally, but beware the hourly chart usually does not make
Posted by Keith D. Rogers on 24 January 2024


