EXECUTIVE SUMMARY: This is the second in a new series of articles discussing the performance of selected indicators (decision rules) to implement marketing plans with a goal of maximizing net price over time while managing price risk. The new series evaluates “true hedge” plans primarily designed for forward cash contracting, where sales contracts will NOT be lifted as done with multiple hedging plans to protect hedging gains. The current research is in direct response to requests for marketing plans that do NOT require use of the futures markets, margin accounts, or lifting hedges. The first concept group to be discussed in the series uses the traditional Price Targets approach to decide when to sell corn based on December futures prices.
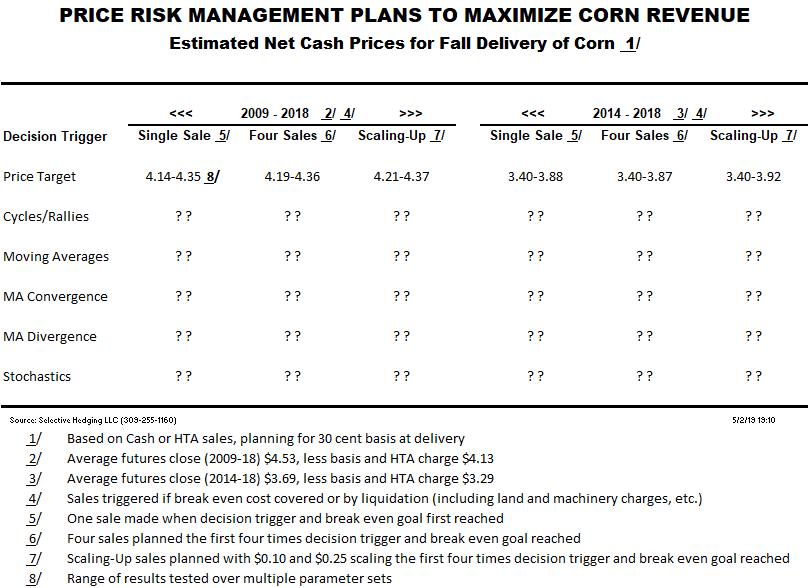
Three versions of the plan were set up to be evaluated each year from 2009 to 2018 with one Single Sale planned, four Incremental Sales planned, and four increments planned with Scaling-Up Sales. The Scaling-Up plans was further evaluated at steps of 10 and 25 cents. The highest average price for the Single Sale plan was $4.75, which was produced with an average hedging gain of 22 cents over the average contract closing price of $4.53. The highest average price for the Incremental Sales plan was $4.76, and for the Scaling-Up plan it was $4.77. Deducting 30 cents for basis and 10 cents for HTA fees, the best implied average cash price was $4.37. While different parameters produced widely different results for all three plans, there was very little difference between the best results for each of the three plans over the 10 years.
Because the overall prices were significantly different over the last five years, the previous options were evaluated again with only the data for the 2014-2018 period. The results were quite different, but perhaps not in the way you would expect. Keep in mind that the average contract close was $3.69 for 2014-2018 instead of $4.53. The highest average price for the Single Sale plan was $4.28. The average hedging gain was 60 cents for five years, compared to 22 cents over 10 years. The highest average price for the Incremental Sales plan was $4.27, and for the Scaling-Up plan it was $4.32. Deducting basis and HTA fees, the best implied average cash price was $3.92. While different parameters produced widely different results for the three plans, there was very little difference again between the results for the three plans over the five years. While the marketing plans could not manufacture prices that did not exist or meet cash flow requirements in some cases, it is obvious that the plans were more effective with the lower prices when it was most needed.
Focusing on objective evaluation of marketing plans makes it clear that many plans CAN DO a good job of managing risk and increasing average net revenue over time. However, you just SHOULD NOT ASSUME THAT ANY MARKETING PLAN WILL COVER YOUR UNIQUE CASH FLOW REQUIREMENTS!
Price Target (commonly discussed as cost-of-production) marketing plans are by far the most common plans taught and used today. They are taught on campus, taught in the field by extension specialists, used by a high percent of marketing advisors, and heavily encouraged by many ag bankers. For that reason alone, the series starts with a discussion of Price Target plans.
The roots of Price Target plans are in basic farm management before many of the marketing tools were available which are at our fingertips today. The basic approach sounds logical, is easy to understand, and carries an implied assumption that break-even profit targets will be met or exceeded with this plan. The main purpose of this article is to evaluate performance of Price Target plans in an objective framework and against established benchmarks. The secondary purpose is to see if it is possible to determine why the most commonly used marketing plans are apparently not working as expected, witness the extensive discussion of the gloom and doom surrounding the reduced farm income and the number of farm bankruptcies.
The ultimate goal for true hedging would be to identify the highest price of the season so that price could be locked in. That is Idealistic and totally unrealistic because no one has such a system! The next best choice is to find the indicator or indicators which consistently lock in the highest average price over time while managing price risk. That is a starting point.
The price target indicator is a broader version of the commonly used cost-of-production or break-even goal to initiate sales. To program decision rules into a computer, specific prices must be used for each decision, but producers have very different ways of calculating COP and the results vary over a wide range of values. Consequently, it was necessary to include a wide range of prices that would cover the range of price targets that individual producers may be using. The range of nine targets considered in this study is from a net cash price of $2.40 to $5.60 per bushel. An average basis of 30 cents per bushel and HTA fees of 10 cents per bushel were used for the conversion between cash goals and futures prices. In addition, 10% was added to each cash target as a profit goal above break-even. The templates were set up to evaluate one or more increments, but primary focus will be on four equal sale increments of 25%. Finally, it is common practice to scale-up the sales if multiple sales are planned. Scaling steps of 10 and 25 cents were evaluated. Excel workbooks are very versatile, and the templates were designed so the following parameters can be reset to fit specific situations: price target, basis, HTA fees, number of planned sales, and incremental steps for scaling-up multiple sales.
Single Sale Plans: Let’s look as some performance data. The first set of results is for one planned sale of 100% when the first sell signal of the season covers the target goal. The focus of the study is on selling 100% of the planned sales for harvest delivery and avoiding storage charges. Some producers may plan to store part of their grain so the 100% only applies to the portion the producer plans to price for harvest delivery. If the price goal is not met so the sale can be executed, then the grain is liquidated at the closing price of the December contract. For the period from 2009-2018, the average annual hedging gain was from 1.53 cents per bushel to a 21.88 cents per bushel. Based on the average closing price for the ten years of $4.53, the average hedged price was from $4.54 to $4.75 and the implied net cash price was $4.14-4.35. The sales for the nine indicator levels ranged from ten planned sales and no liquidation sales at a cash price target of $2.40 to only two planned sales and eight liquidation sales at the $5.60 target.
The devil is often in the detail that usually escapes detection because detailed records are not created, and rarely is there accountability in any form. There are some challenges in the details, as you should expect. Hedges using a price target from $2.40 to $3.20 covered the price target each year, but also produced hedging LOSSES in three of the ten years. For the price target of $3.60, the hedged price did NOT cover the target two of the ten years and had losses four years. At a price target of $4.00, the hedged price did NOT cover the target five of the ten years and had losses four years. At $4.40, the target was NOT covered seven of the ten years, had gains of less than 20 cents five years, and had losses four years. At $4.80, $5.20, and $5.60, the target was only covered three times, twice, and once respectively, with all three producing hedging losses in four years.
Before drawing any major conclusions, let’s move forward to the last five years (2014-2018). The period of five years has certainly resulted in lower overall prices. The question is whether the lower prices impacted the way the plans worked. The average hedging gain was from 11.85 (4 target levels) to 59.60 cents (3 gains over 50 cents). Wow! Hedging activities had a much greater impact (59.60 vs. 21.88 cents) on the net realized price during this period of relatively low prices.
Based on the average closing price for the five years of $3.69, the average hedged price was from $3.80 to $4.28 and the implied net cash price was $3.40-3.88. The sales for the five years ranged from five planned sales and no liquidation sales at a cash price target of $2.40 to zero planned sales and five liquidation sales at $5.60. For price targets of $2.40 to $3.20, hedges were placed all five years. At $3.60, hedges were placed three of the five years. At $4.00, one hedge was placed, and no hedges were placed for price targets of $4.40 or higher.
While few producers set a goal of pricing 100% of the planned sales in one transaction, the results of the price target marketing plan provide the first insight into why many marketing plans are NOT producing the desired results. Perhaps the most glaring fact is that a Single Sale price target plan worked from 2009-2016 – IF, repeat IF, the cash requirement was estimated at $4.00 or less, and IF the correct price target was used as a trigger. If the first sell opportunity at $3.60 or higher was used, the average futures price was $5.03 for those eight years. The estimated cash price (adjusted for basis and HTA fees) would have covered total cash flow up to $4.63 per bushel. That is the good news that is remembered.
The bad news that is usually forgotten or denied, is that the same $3.60 trigger would have only generated an average futures price of $3.62 for 2017 and 2018. The adjusted cash price would only cover a cash flow requirement of $3.22 per bushel. If producers really have a cash flow requirement (not just COP) approaching $4.00 per bushel, one source of the financial stress is obvious.
“Why isn’t MY marketing plan working?” That is the question that is being asked in every coffee shop and farmers’ meeting. The implication of the question is that there was some institutional reason the system was supposed to cover YOUR arbitrary price targets. We could spend hours talking about whether that should be variable production costs, variable and fixed costs, or total production costs plus several add-ons. The add-ons might include family living, capital investment, profit, etc. For now, just leave the topic open, and assume we are addressing specific price targets, regardless of how they were established.
Putting all the cards on the table, these marketing plans DID work at every level. The fact is that the market did NOT need or want grain at the prices some farmers had set as their targets. For each of the plans in the study, either the price target was reached so a hedge could be placed, or the target was not reached, and the grain was liquidated at the end of the contract. The fact that the resulting price did not cover the target price is not a failure of the marketing plan. The problem is that the results are unexpected because past failures have not been documented in an objective way. The plan is flawed when farmers are led to believe that the market will offer a price to cover any target they set. Keep it simple; this is a flawed plan built on unrealistic assumptions that is repeated year after year.
The results for the last five years (2014-2018) make the flaw even more glaring. The highest average futures price was $4.28, with an adjusted cash price of $3.88. That average price was NOT achieved with a price target of $4.00, but rather with a target of $3.20. In all five years, the cash price covered a cash flow requirement of more than $3.50.
And what if $3.20 had been the target for the whole 2009-2018 period? The average futures price with the $3.20 target was $4.73 per bushel instead of $4.75. The average futures price for 2017-2018 was $4.00 instead of $3.62. Therefore, the adjusted cash price for 2009-2018 would have dropped from $4.35 to $4.33, but no year would have failed to cover a $3.50 cash requirement. By using a price target that has been documented to work over multiple years rather than some arbitrary target, an average of two cents per bushel would have been given up in exchange for covering a $3.50 goal every year.
There are two lessons here. The first is that an arbitrary cost-of-production is not as effective to achieve the maximum price over time as an alternate value that has been documented performance. For 2009-2018, $3.20 was the magic number! The second lesson is that if the producer has a cash flow requirement higher than $3.50 per bushel, the focus needs to be on reducing cost per bushel, not hoping that a price target marketing plan will solve the problems.
Incremental Sales Plans Without Scaling-Up: A popular variation of the basic Price Target marketing plan is to select a price target and then plan to spread the sales out with multiple incremental sales. Many producers introduce a major flaw in the plan by not specifying the number of sales planned. Therefore, it is not possible to know what percent of the expected crop to sell with each increment. With no clear statement of intention, there is no way to evaluate how the plan would perform over time. The goal of spreading the sale is to catch future rallies in the market above the initial target price. Most producers combine the incremental sales plan with scaling-up, and both versions will be summarized for comparison.
The first variation of the marketing plan is with incremental sales to sell 100% of the planned harvest delivery sales with a specified number of equal increments at a selected price target. For example, sell four equal increments (25%) at $4.00 or greater trigger. As with the single increment sales, all residual increments which have not been priced by the end of the contract (Dec for corn) are liquidated at the contract closing price.
For the 2009-2018 period, the range of hedged prices was $4.59-$4.76 ($4.19-$4.36 cash). The highest average hedged price was $4.76 ($4.36 cash) with a target of $3.60. Forty sales were planned, thirty-two were initiated, and eight liquidation sales were required. For the 2014-2018 period, the range of hedged prices was $3.80-$4.27. The highest average hedged price was $4.27 ($3.87 cash) with a target of $3.20. Only one-half of the 40 planned sales were initiated and 20 sales were forced liquidation.
Comparing Single Sales with Incremental Sales: Dividing the sales into multiple increments had very little impact. The range of prices changed slightly. The price targets producing the best average prices did not change. The number of planned sales and forced liquidation sales did not change. Finally, for these years, the goal of incremental sales catching rallies was not realized.
Incremental Sales Plans With Scaling-Up: Perhaps the most popular and widely used variation of the Price Target marketing plan is an initial price target with scaling-up. The scaling-up plan is to sell 100% of the planned harvest delivery sales with a specified number of equal increments after starting when a selected price target is met. For example, the plan might be to sell four equal increments (25% each), starting at $4.00 and scaling-up sales at $4.10, $4.20, and $4.30. As with the single increment sales, all residual increments which have not been priced by the end of the contract (Dec for corn) are liquidated at the contract closing price.
For the period from 2009-2018, the benchmark is the average contract closing price of $4.53. The range of hedged prices was $4.59-$4.77 with 10-cent steps. The high average at $4.77 ($4.37 cash) was produced with planned sales starting at an initial target of $3.20. Only one forced liquidation was required over 10 years. The range of hedged prices with 25-cent steps was $4.62-$4.74. The high average at $4.74 ($4.34 cash) was produced with a starting target of $2.80. One forced liquidation sale was required.
Looking only at the last five years (2014-2018), the benchmark is the average contract closing price of $3.69. The range of hedged price with 10-cent steps was $3.80-$4.32. The high at $4.32 ($3.92 cash) was produced with an initial target of $3.20 and only one forced sale in five years. The range of hedged prices with 25-cent steps was $3.80-$4.27. The high at $4.27 ($3.87 cash) was produced with a starting target at $2.80 and required one forced sale in five years.
Comparing Scaling-Up with Single Sales or Incremental Sales: Adding step increments to scale-up sales had very little impact on the range of resulting hedged prices. It did lower the initial target to start the sales when using the 25-cent steps. Finally, scaling-up did not change the execution of planned and forced liquidation sales, and the goal of catching rallies was not realized.
Summary and Conclusions: There are two major reasons to evaluate the past performance of a marketing plan. The first is to determine whether the plan is specific enough to be able determine if the plan could be executed as intended. Failure of the manager to execute the plan, or failure to generate a specific price or revenue level, should NOT be interpreted as a plan failure. If the plan is NOT being implemented consistently, perhaps the plan needs be rewritten to be more specific and to make implementation more objective. We all know the critical issue is knowing when to make the planned sales. There is more than enough confusion and volatility in the market to make the decision process emotionally challenging. Marketing plans should NOT add more confusion and emotional stress because the plan is vague about when and how to execute the sales.
The second reason to evaluate the past performance is to determine if the plan could have produced the expected and desired results if implemented as designed. If the plan could not have produced the desired results, the failure is to design a plan based on realistic expectations, NOT failure of the plan to perform as designed. It is necessary to review past performance to determine if the desired results are in line with realistic expectations. If the performance is NOT in line with realistic expectations, it may be necessary to change the plan. If that is the case, the whole marketing plan concept is serving as a mental buffer to avoid facing the painful financial reality and the critical need to reassess cash flow requirements, including production costs, family living expenses, asset investments/debt servicing, and profit goals to provide for future growth.
Five major observations were highlighted:
1) An arbitrary cost-of-production target is not as effective at managing risk and maximizing revenue as an alternate value that has documented performance over time.
2) Producers who have a cash flow requirement of more than $3.50 per bushel need to focus on reducing costs rather than hoping that a Price Target marketing plan will solve the problem.
3) Moving from a Single Sale plan to an Incremental Sale plan had very little impact on trigger target, price range, best price, or number of forced sales.
4) Moving to a Scaling-Up plan also had very little impact on price range, best price, or number of forced sales. The 25-cent step version did cause a change in the best starting trigger target.
5) The Price Target plan is very stable over a wide range of prices and was more effective generating hedging gains during the years with low prices when it was needed. Unfortunately, the stability indicates that the plan is not very responsive to marketing conditions and is not designed to simultaneously take advantage of early season pricing opportunities and also be responsive to major rallies later in the season.
I submit that the most dangerous and damaging aspect of not having an open discussion about how various marketing plans perform over time is the perpetuation of blind expectations that any marketing plan will generate the revenue needed to support any production and growth plans chosen. This allows managers to avoid facing the tough internal financial decisions that will have significant impact on the price and revenue needed to execute those plans. Focusing on objective evaluation of marketing plans makes it clear that many plans CAN DO a good job of managing risk and increasing average net revenue over time. However, you just SHOULD NOT ASSUME THAT ANY MARKETING PLAN WILL COVER YOUR UNIQUE CASH FLOW REQUIREMENTS, and you SHOULD be sure you are using a plan that has a proven record of performance. You don’t plant seed without a record of performance. Why would you use a marketing plan without a historical record of performance? Ask your marketing advisor for documentation before you choose a marketing plan!
The table below summarizes the results for the Price Target plans. Results for the other plans in the table will follow in the series of articles to compare performance of selected risk management and price maximization plans.
Posted by Keith D Rogers on 28 June 2019