
I had an opportunity a few days ago for a long chat with a farmer who has had less than a satisfactory experience with a series of marketing advisors. What he believes has been missing is a rule based approach to reduce emotions and provide guidance on deciding when to place or lift hedges. If you are in the same boat, here are some tips and factual information to help understand the markets, all of which can be put directly on your charts to help you identify when the market is turning up or down.
The rule structure and input information would be the same across other commodities, but this example is using CZ22, closing prices, and MA5/17/35 to analyze the market trend. As a reminder, the major trend will be up if CP>MA5>MA17>MA35 and they are all moving up. On the way down, Price will lead the way so the reverse will be true – CP<MA5<MA17<MA35 and they are moving down. This system is no utopia; it is just one set of rules to demonstrate a process and outcome for 193 actual trading days.
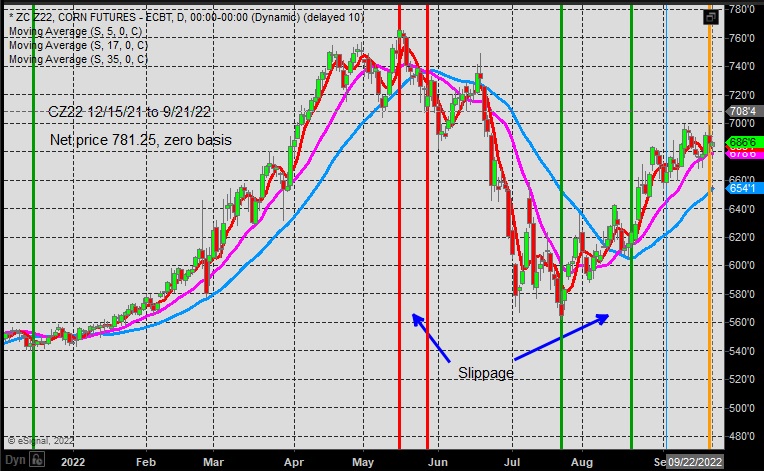
The last day that CP>MA5>MA17>MA35 and all were up before the trend turned down was 5/16/22 with a close of 765.50. The first day everything lined up on the downside was 5/26/22 with a close of 718.75, CP<MA5<MA17<MA35, and all moving down. I am not suggesting that the 45-50 cent drop isn’t significant, but in the context of a rally from June 2020 from 380.00 to the 718.75 sell signal, it does not weigh in as the most important issue.
To follow through, the last day that CP<MA5<MA17<MA35 before the price turned up was 7/22/22 with close at 564.25. The first day that everything lined up in rally mode was 8/19/22 with 623.25 close and CP>MA5>MA17>MA35. Again, the 55-60 cents of hedging gain left on the table is not insignificant, but must be evaluated in the context of the overall performance.
Rather than multiyear hedge decisions from 380 to 765.50, let’s just focus on hedging with CZ22 from 12/15/21 when the close was 543.75 until the close on 9/21/22 at 685.75. If the hedge was placed at 718.75 and lifted at 623.25, a hedging gain of 95.50 could have been booked. That would make the current net value of the unhedged grain about 780-785, and puts the net price above the highest closing price offered and helps accept that more than a dollar slipped away. To be totally honest and candid, the net price could now be 105.75 higher, and 125.75 over the 765.50 high, if the slippage at the top and bottom could be avoided without generating new false signals. That concern can only be addressed when backtesting is done with due diligence to verify the total impact of any rule change.
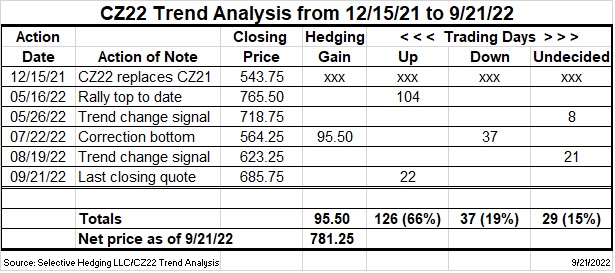
Uncertainty is the fear factor that keeps many farmers from being able to make good decisions. In this real time example, there have been 193 trading days since 12/15/21. The trend was defined as up for 140 days, down for 35 days, and undefined for 9 days during the progression from up to down, and 22 days during the progression from down to up. That means the trend was defined 85% of the time and only undefined 15% of the time during the transitions at the top and bottom.
The obvious question needs an answer. “Why wasn’t a signal registered when price first crossed MA5 at the top or at the bottom? It is an early signal that a trend change may be coming, and it will always happen at the top and bottom. But it also happened many times between 12/15/21 and 5/26/22 when it did not follow through. Call it false signals because all but two of those points were not the top or bottom of the market movement.
What about MA5 crossing MA17? There were far less of those crossovers, and they do always happen at the top and bottom also, but again there were several that were not at the top or bottom of the rally or selloff. Then, what about MA17 and MA35 crossover? There were only two, one in late December and early January, and the other at the top of the rally. The MA17/35 crossover is particularly useful in helping to identify corrections when the market will turn back up, or vice versa.
Finally, what about basis? This example demonstrates maximizing net futures price with selective hedging and implied zero basis. To get from here to cash price, the next step is basis maximization (or minimization when it is quoted as minus under futures). When I started putting this data together, I was aware of basis quotes from more than $2 over to more that $0.50 under the CZ22 contract. Basis is impacted far more by local S&D than futures prices, and requires detailed records of local basis conditions and prices to effectively manage specific basis for specific farms. Relatively speaking, basis becomes much more important in a flat market than trending markets like we have seen more recently. Both are significant components of cash price determination and revenue maximization. Like each aspect of marketing, basis management requires another set of data specific to a particular area which is more difficult and costly to obtain, and the major reason I leave the basis management to local individuals. I know the basis information for my area, but it certainly has little relationship to the guys that are talking about plus a dollar or two. I leave that one to others who have more experience with wide basis movement.
In summary, the essence of deciding which rule based indicator will be used as a trend indicator or hedging signal is having the research capability and documentation to evaluate the performance of each indicator over multiple years for consistency and effectiveness. Once that is established, putting information on the chart as described above makes it extremely easy to glance at the chart and see if a trend change is developing. To emphasize the obvious, if CP>MA5>MA17>MA35 and all are moving up is the definition of a rally underway, and CP<MA5<MA17<MA35 and all are moving down is the definition of a correction, then the progression from the first condition to the second is the early alerts that the market is turning down, and from the second condition back to the first is the early alert that the market is turning up. Given that those progressions happen at every top and every bottom, and the capability to calculate in advance what market price will create a crossover, and to be able to enter market orders in advance, “no one could know” just is not defendable. It is three months until CZ22 expires, but the system called the trend correctly 85% of the trading days so far, and produced an effective net price above the highest traded closing price. The true uniqueness of the system is that these numbers can be reproduced now or with the data for this period 5, 10, or 20 years from now.
Posted by Keith D. Rogers, 22 September 2022


