
If you are still looking for ways to answer when and how high the market is going in 2022-23, good luck. If you still have the flexibility to stay open when the market is trending up, and lock in prices when the market turns down, the six charts for MY22-23 corn, soybeans, and wheat provide a lot of answers that are easy to understand. These are for long term hedging, not day to day trading or trying to catch the top of rallies. They are meant to help avoid selling in the bottom third of the price range where the bulk of the grain is sold.
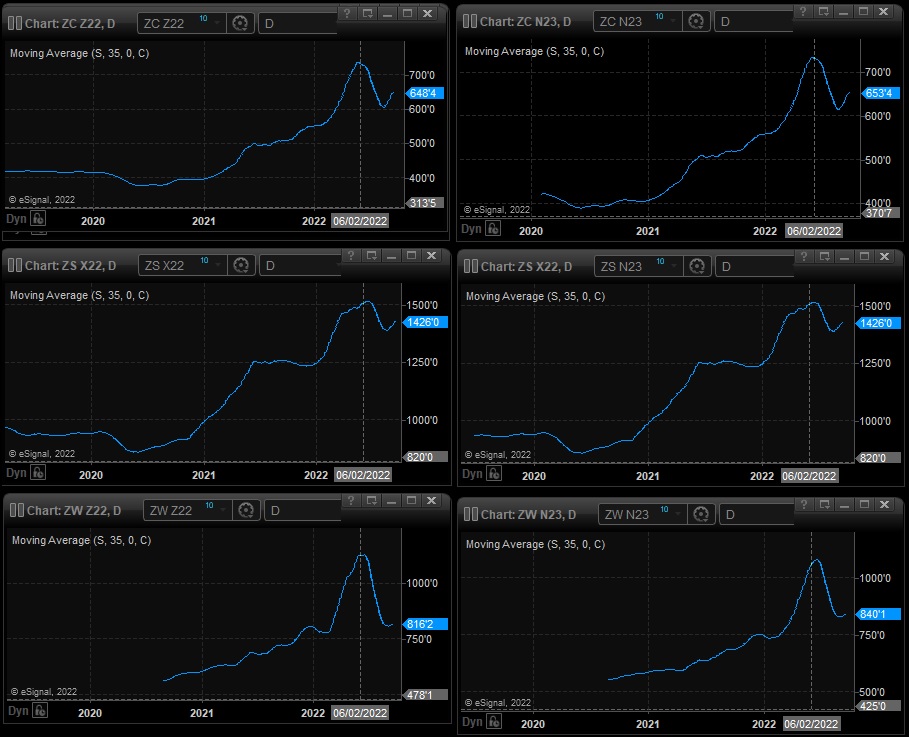
Before you can jump on the band wagon with any marketing plan, you need to see historical performance and look for consistency. Looking back to beginning of 2020, there have basically been only three trend changes in three years. On or about 5/15/2020, the major trend indicator turned up. On or about 6/15/2022, the trend indicator turned down. Finally, it appears that on or about 8/23/2022, the trend indicator turned up.
Independent of other restrictions such as risk avoidance, fear, or other non-economic issues, the message has been very clear and easy to implement a marketing plan. In May 2020 it was to lift or offset any existing hedges and avoid pricing any more grain until forced into cash flow sales, and then to replace the sales with paper ownership. In May 2021, the message for MY 21-22 was still the same, delay pricing until forced into cash flow sales, and replaces the sales with paper. In May 2022, the message was the same, and remained the same until June 2022. Price all MY21-22 crop for delivery, and price as much of MY22-23 as you risk tolerance would stand. In August 2022, the indicator said the trend was turning up, and it was time to lift or offset hedges.
“But nobody could know.” Partially correct. Many people, including some very high powered analysts and companies did not know. In that case, you have to make decisions based on probabilities. Because of the mathematical structure of the moving average, it was possible to do a simple calculation for every day of roughly a thousand day period and know if it was possible for the trend to turn up of down the next day, and in many cases for several days. Bottom line, no one could know for sure that the market was going to rally for more than two years, but many knew on a day to day basis whether the trend was still going to be up or down for one or more days.
In short, no one knows how long the market will rally or sell off, but there are indicators that do a great job of identifying the direction of the long term trend. This is just one of many indicators that help answer the questions about whether the market is going up or down.
Posted by Keith D. Rogers, 19 September 2022


