
EXECUTIVE SUMMARY: This is the second in a planned series of articles reviewing and summarizing the estimated performance of selected trend indicators based on simple moving averages. The main objective is to document the comparative performance of selected indicators to help producers choose the ones that are most likely to assist in making effective and timely price risk management decisions. If this research isn’t the cutting edge, it is certainly close.
A template was created in a spreadsheet format using the last 300 days of the December Corn contracts for 2008-2012. Formulas were written to simulate hedging decisions for nine moving average based indicators and to calculate the hedging gains or losses based on the predefined hedging rules. The average contract closing price was $5.25 for the five contracts.
Four indicators produced net hedging gains of $0.02-$0.17 per bushel (commissions and fees ignored), resulting in net hedged prices of $5.27-$5.42. The trading rules were then modified to give greater emphasis to major trends, and seven of the indicators produced net hedged prices of more than $5.80, or more than a 10% hedging return above the $5.25 base average. Five modified indicators had no losing trades over the life of the five contracts.
Before we go any further, it is incumbent on me to warn you of potential errors. First, the analysis is based on the last 300 trading days of the contracts, starting in October of the year prior to production. Choosing a different starting point could produce a different set of answers, but most producers do not give serious consideration to hedging farther in advance than this. The data sets are believed to be accurate, but they have not been cross checked with data from other vendors. The analysis was accomplished with private templates developed specifically for this purpose. Each template contains approximately 3,250,000 characters in five worksheets with more than 13,000 formulas per sheet. The formulas have been checked repeatedly but it is very difficult to verify that no errors exist anywhere in the template. While the results are believed to be as accurate as reasonably possible, they should be reviewed as research analysis results and not as “black box” trading systems.
“One size does not fit all!” It needs to be stated and restated because everyone may have slightly different objectives for their price risk strategy which can lead to profound differences in desired outcome. Thus, selecting the “best” indicator comes down to a lot of personal choices.
For true hedging, the goal would be to identify the highest price for the life of the contract so that price could be locked in. Idealistic and totally unrealistic, because no one has that system! The next best choice might be to find the indicator, or indicators, which lock in the highest average price over time. That is a starting point.
The basic objective of hedging is to generate a price greater than the harvest delivery price which would result with no price risk management. So the second goal might be to produce an average hedged price that exceeds the default price at the end of the contract. It may come as a surprise that a system designed specifically to identify a falling price trend may not signal to lock in a price that is greater than the default price because the price may rally again later to an even higher price.
Other performance measures help to identify indicators which will achieve the two main objectives. The ideal hedging indicator would produce only one “sell” signal, and perhaps none at all in a rising market. For a market that was going to be inverted and rally into the high for the season, you would want no “sell” signals. For a market that reaches its high during the life of the contract and then falls, you would want only one “sell” signal at that top. So, as we scan the results, the indicator which produces the highest average price with the fewest signals should move to the top of the list.
Let’s take a look at the estimated performance data now. Initially we were focused on MA(5,35). Then we extended the family of closely related indicators to include MA(5,17), MA(5,35), and MA(17,35). For comparison, the Closing Price crossing MA(5), Closing Price crossing MA(17), and Closing Price crossing MA(35) were added. Earlier I had mentioned that I am very risk averse so I like to monitor Closing Price crossing over the six day moving average posted four days ahead, noted as MA(6×4), because it tends to smooth out some of the short term volatility. Finally, I have added MA(17) and MA(35) as naked trend indicators. All of the first seven involve a crossover signal, but the last two simply involve selling when the trend indicator starts to decline, or staying open when the average is increasing.
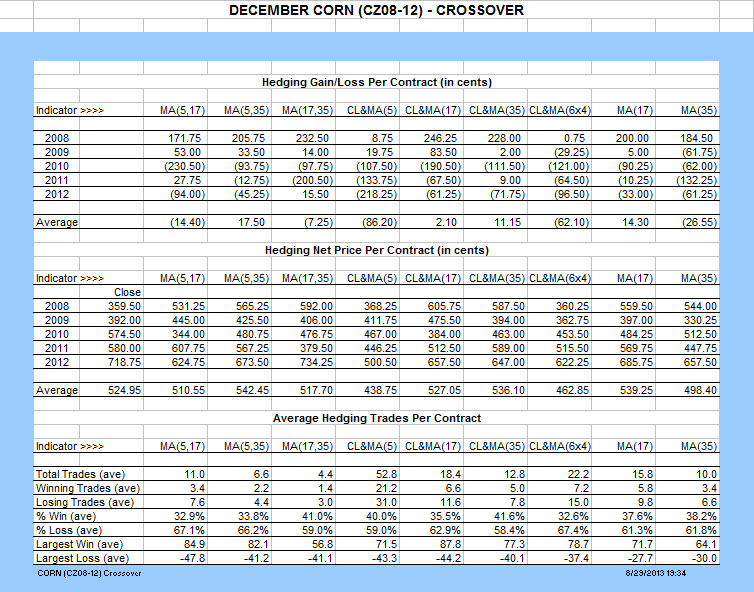
Scanning across the bottom row of the Hedging Gain/Loss table, four indicators stand out for achievement and two for lack thereof. MA(5,35) had the highest average gain over the five years with an addition of $0.17 per bushel (commissions and fees ignored). MA(17) followed with $0.14, CL&MA(35) with $0.11, and CL&MA(17) with $0.02. CL&MA(5) and CL&MA(6×4) produced average losses of $0.86 and $0.62 respectively. As shown on the bottom line of the Hedging Net Price table, it follows that these six indicators produced average estimated net prices of $5.42, $5.39, $5.36, $5.27, $4.62 and $4.38. These hedged prices are compared to the average default closing price for the five years of $5.25. The three achievers with the highest net price exceeded the average default price and produced a positive return to price risk management.
The number of trades is related to the cost for commissions and fees, and it is related to the intensity of time required to implement a price risk management strategy, so there should be a preference for fewer trades compared to more. Perhaps the difference in this characteristic is as striking as any. From the Total Trades line of the Average Hedging Trades table, the average number of sell signals ranged from a low of 4.4 to a high of 52.8. With less being the preference, MA(17,35) leads the way with only 4.4 trades, followed by MA(5,35) at 6.6, MA(35) at 10.0, MA(5,17) at 11.0, CL&MA(35) at 12.8, MA(17) at 15.8, CL&MA(17) at 18.4, CL&MA(6×4) at 22.2, and CL&MA(5) at 52.8. It may be noted this order and magnitude of trading signals is almost identical to the order and magnitude of signals that were reported for wheat in an earlier article.
The differences in the largest average winning and losing trades were relatively small. The largest average win ranged from a low of $0.56 to a high of $0.87 per bushel. The largest average loss ranged from a low of $0.27 to a high of $0.47.
The choice of the best performance is personal and depends on multiple factors. Looking at the collective goals, MA(5,35), MA(17), and CL&MA(35) probably come closest to meeting the stated objectives, but CL&MA(17) deserves consideration. Other producers might reach a different conclusion, and that’s great. The point is to learn to compare and evaluate various indicators in order to find ones you are most confident will do what you want, and ones with which you are comfortable with the inherent characteristics.
But before you put all of you eggs in one basket, let’s take a look at another set of tables. In an earlier article or discussion post, I commented that some of the indicators were giving false signals, and those signals could be reduced with a simple adjustment. Specifically, what I had in mind was to ignore the signal to buy or sell if the crossover signal came at a time when the major trend was still in the opposite direction. For example, ignore the signal when MA(5) crosses down through MA(35) and MA(35) is still trending up, or vice versa. This is not adding a subjective decision that can not be backtested. It is just modifying the basic rule to include an additional objective condition.
With that in mind, a new template was constructed that checks for major trend before deciding whether to give a buy or sell signal. Essentially, everything else is the same so the tables for the modified template should look very similar to the previous tables. I suggest that you print out both sets of tables so you can do a side by side comparison of the results.
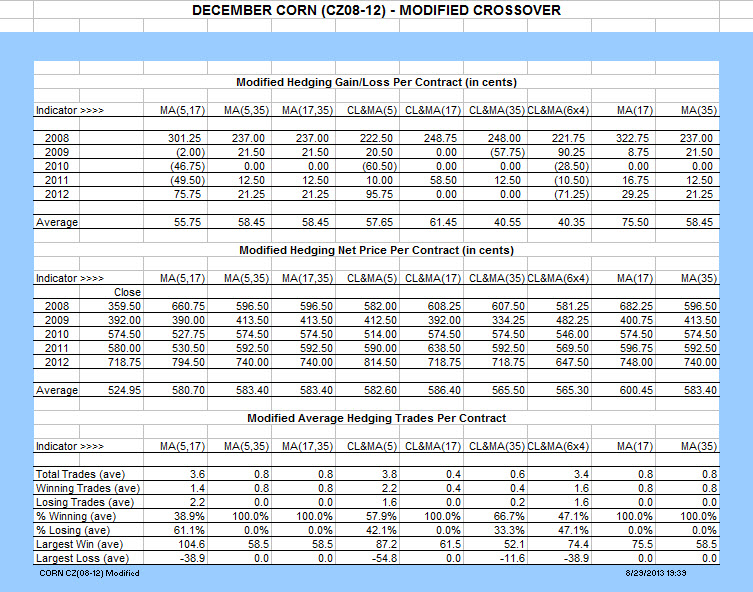
Scanning across the bottom row of the Modified Hedging Gain/Loss table, all of the indicators now produce an average gain, while one indicator stands out for achievement and two for lack thereof. MA(17) moved to the top of the list with a gain of $0.75 per bushel, followed by CL&MA(17) with $0.61, MA(5,35), MA(17,35), and MA(35) at $0.58, CL&MA(5) at $0.57, and MA(5,17) at $0.55. CL&MA(35) and CL&MA(6×4) are at the bottom of the list at $0.40.
Comparing the results from the original rules with the results from the modified rules, CL&MA(5) and CL&MA(6×4) increased the average net realized price estimate by $1.44 and $1.03 respectively. MA(35), MA(5,17), MA(17,35), MA(17), and CL&MA(17) followed with increases of $0.85, $0.70, $0.66, $0.61, and $0.59 respectively. Seven of the nine indicators produced an average net price of $5.80 or more with one above $6.00 (commissions and fees ignored). Compared to the default price of $5.25, this represents more than a 10% increase as a return to the price risk management strategies.
The average number of sell signals dropped significantly to an average low of 0.4 and high of 3.8. Six indicators produced an average of less than one sell signal per contract. They are CL&MA(17) at 0.4, CL&MA(35) at 0.6, and MA(5,35), MA(17,35), MA(17), and MA(35) at 0.8. Special attention goes to MA(5,35), MA(17,35), CL&MA(17), MA(17), and MA(35) which had NO LOSING trades on any of the five contracts, and CL&MA(35) which had only one losing trade of $0.58.
Wait, it gets better! The five indicators which had no losing trades all gave only one sell signal per year or kept an open position to the end of the contract. For a pure hedger who probably is using cash forward contracts, it doesn’t get much better. Perhaps one can find an indicator that would produce a higher price with no losing trades, but that would be the only improvement. Again, be reminded that past performance is no guarantee of future success, but it certainly does attract attention.
The average size of winning and losing trades changed a bit with the modified rules. The largest average win with the modified rules ranged from a low of $0.52 to a high of $1.04 per bushel. The largest average loss with the new rules ranged from zero to $0.54.
As stated earlier, there are plus and minus points to various indicators, and not everyone will choose the same one. Looking at the list of nine indicators, it is difficult to see a lot of differences. The estimated price range from $5.65 to $6.00 is very close over five years. Five indicators had no losing trades, and one had only one loss. With the remaining three, there is a slight difference in the win/loss percentages and the average loss, but not enough to completely eliminate the indicator from consideration. Basically, any of the nine indicators would be more reliable and consistent than most of the marketing approaches used by most producers.
The logical extension of this study for selective hedging would be to examine the charts to identify rallies and corrections deemed worthy of an exit and entry in the market, and then to focus on finding trading strategies and parameters that would provide buy and sell signals as close to those points as possible.
There is a lot of new material here for your consideration, and I hope I have been able to focus on issues you will want to consider when selecting a trend following indicator for a pure or selective hedge to help manage price risk. Take the time to digest the material and don’t hesitate to send questions if you need help getting your hands around any of this.
Remember that all of the above analysis was accomplished by dropping a data set for a contract into a spreadsheet, and then programming in the trading rules and accounting formulas to keep track of the gains and losses. In keeping with the overall goal of the website, these are all things you can do at your own desk.
Posted by Keith D. Rogers on 29 August 2013


