
EXECUTIVE SUMMARY: This is the third in a planned series of articles reviewing and summarizing the estimated performance of selected trend indicators based on simple moving averages. The main objective is to document the comparative performance of selected indicators to help producers choose the ones that are most likely to assist in making effective and timely price risk management decisions.
A template was created in a spreadsheet format using the last 300 days of the November Soybean contracts for 2008-2012. Formulas were written to simulate hedging decisions for nine moving average based indicators and to calculate the hedging gains or losses based on the predefined hedging rules. The average contract closing price was $11.45 for the five contracts.
Three indicators initially produced average net hedging gains of $0.48-$1.08 per bushel (commissions and fees ignored), resulting in net hedged prices of $11.94-$12.54. The trading rules were then modified to give greater emphasis to major trends, and all nine of the indicators produced average net hedged prices higher than the $11.45 base price, with a best of $13.18. Four of the nine indicators had only one or two losing trades over the life of the five contracts.
I trust that you have read the two previous articles (wheat and corn) which contained more detailed information about the backtesting approach and caveats about the data. If you have not read one of the previous articles, please do. The results reported here are based on the last 300 trading days of the contracts. While the results are believed to be as accurate as reasonably possible, they should be reviewed as research analysis results and not as “black box” trading systems.
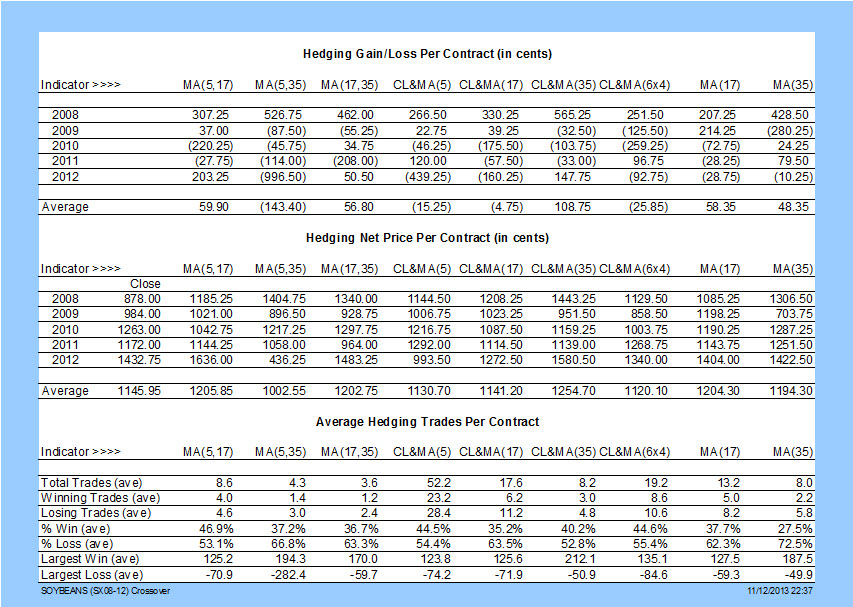 Let’s take a look at the estimated performance data now. Scanning across the bottom row of the Hedging Gain/Loss table, five indicators stand out for producing an average hedging gain of $0.48 or more per bushel. They are MA(5,17), MA(17,35), CL&MA(35), MA(17), and MA(35). As shown on the bottom line of the Hedging Net Price table, it follows that the five indicators produced average estimated net hedging prices of $11.94 to $12.54. These hedged prices are compared to the average default closing price for the five years of $11.45.
The number of trades ranged from an average of 3.6 to 52.2. It may be noted that this number of trading signals is almost identical to the number of signals that were reported for wheat and corn in earlier articles.
The differences in the largest average winning and losing trades were slightly higher with the soybeans than with the wheat and corn. The largest average win ranged from a low of $1.23 to a high of $2.12 per bushel.
The largest average loss ranged from a low of $0.49 to a high of $2.82.The choice of the best performance is personal and depends on multiple factors. Looking at the collective goals for hedging, MA(17) may come closest to meeting the goals laid out earlier, but MA(5,17), MA(17,35), CL&MA(35), and MA(35) each have merits.
 But before you put all of you eggs in one basket, let’s take a look at the second set of tables based on the modified trading rules. Scanning across the bottom row of the Modified Hedging Gain/Loss table, all of the indicators now produce an average hedging gain, while one indicator stands out for achievement. CL&MA(5) moved to the top of the list with a gain of $1.72 per bushel. CL&MA(6×4) and CL&MA(35) follow with gains of $1.18 and $1.08. Please refer to the table for details on the other indicators.
Comparing the results from the original rules with the results from the modified rules, MA(5,35) increased the average net realized price estimate by $2.13 per bushel, followed by CL&MA(5) and CL&MA(6×4) with gains of $1.88 and $1.44 per bushel. Three of the nine indicators produced an average net price of $12.50 or more with one above $13.00 (commissions and fees ignored).
The average number of sell signals dropped significantly to an average low of 0.8 and high of 12.2. Four of the nine indicators produced an average of one sell signal or less per contract.
The average size of both winning and losing trades changed with the modified trading rules. The largest average win with the modified rules ranged from a low of $1.01 to a high of $1.55 per bushel. The largest average loss with the new rules ranged from $0.03 to $0.62.
As stated earlier, there are plus and minus points to various indicators, and not everyone will choose the same one. Looking at the list of nine indicators, there are some differences. The estimated price range from $12.17 to $13.18 is quite small over five years and with the normal volatility in the soybean complex. Four indicators had only one losing trade or less per contract, and only one or two losing trades over the life of the five contracts. Four of the strategies had 60% or more winning trades. Two had average losing trades of less than $0.05. Basically, four of the nine indicators would be more reliable and consistent than most of the marketing approaches used by most producers.
The logical extension of this study for selective hedging would be to examine the charts to identify rallies and corrections deemed worthy of an exit and entry in the market, and then to focus on finding trading strategies and parameters that would provide buy and sell signals as close to those points as possible.
Again, there is a lot of new material here for your consideration, and I hope I have been able to focus on issues you will want to consider when selecting a trend following indicator for a pure or selective hedge to help manage price risk. Take the time to digest the material and don’t hesitate to send questions if you need help getting your hands around any of this.
Remember that all of the above analysis was accomplished by dropping a data set for a contract into a spreadsheet, and then programming in the trading rules and accounting formulas to keep track of the gains and losses. In keeping with the overall goal of the website, these are all things you can do at your own desk.
Posted by Keith D. Rogers on 3 September 2013
Edited 12 November 2013


