
The Monthly Corn Demand Chart below includes all the monthly P&Q pairs for 2017-2021. The blue dots are the reported prices, and the paired red dots are projected off a trend line. The five dots at the top of the chart are May-September 2021, and the ones of concern. What appears to be missing is the paired red projection prices because they are buried $1.59-$1.95 lower with the other projections below $4.00.
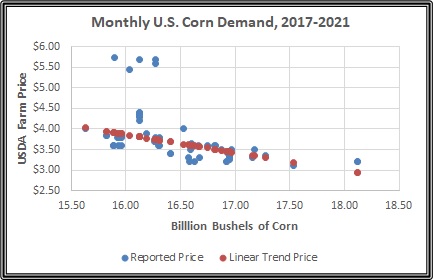
The five outlier points are glaringly conspicuous, and appear to be completely out of place. Is anyone willing to share ideas or insights into what would make the demand curve jump nearly $2.00 after being very stable for four years? My sense is nothing dramatic has happened on the domestic use side, so increased demand pressure will have to come from the export side. When will those new number show up on the WASDE S&D reports?
Posted by Keith D. Rogers on 27 September 2021


