
SUMMARY: The Hedge-It price forecast in January for the 2014/15 marketing year was $3.92 ($3.53-$4.32) based on USDA’s projected beginning stocks of 1.79 billion bushels. When USDA dropped the beginning stocks estimate to 1.15 billion bushels in May, they were able to project a price of $4.20 ($3.85-$4.55). With the numbers updated to May, Hedge-It is forecasting a price of $4.46 ($4.09-$4.84).
A simplified price projection model for corn was posted on the website last August to direct attention to the importance of keeping the basic supply and demand concepts in focus. The major point was that price anticipation or projection is not as complicated as the media and some marketing advisors would like you to believe. Once the base demand is established, the price projections are dominated by supply. Given a rough estimate of the beginning stock inventory, supply becomes a function of acres and yield. Once planting is complete and USDA has its estimates for planted acres, yield is the major determinate. That yield estimate normally improves as the season develops, but at this stage of the production cycle, it is a guestimate at best.
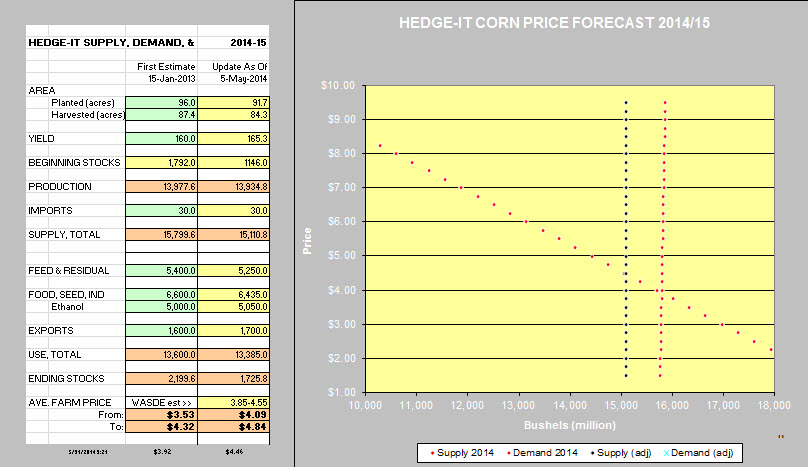 I find the new projections for 2014 very interesting. The Hedge-It table and original supply and demand graphs were developed in January for a presentation in San Antonio. The left side of the table contains the estimates as of 15 January 2014 before any of the USDA production numbers were available. Based on a simplified econometric model, supply was estimated at 15.8 billion bushels and demand at 13.6 billion bushels. With supply and demand graphed on the chart, the projected price was $3.92, with a range of $3.53 to $4.32.
The focus in January was that for the first time in several years, an aggressive marketing plan would be required to cover cost of production for many units with total cost in the $4.50 to $5.50 range. In late January, it looked like the spring revenue protection number would come in somewhere in the $4.50 to $4.80 range, or maybe even up to $5.00. Of course, since the protection is only for up to 80% on most farms, the effective protection was only to $4.00 or less. The actual number came in at $4.62, or only about $3.70 with 80% coverage. That level is adequate to cover variable costs for most farms, but not adequate to cover total costs when all assets are valued at market value and reasonable charges are assigned.
The WASDE report came out in May (second column of table), with a projected median price of $4.20 and a range from $3.85 to $4.55. Where are the differences? USDA’s projected acres were lower than the Hedge-It model, but the projected yield was higher than the Hedge-It model, resulting in a net difference of less than 0.3 of one percent. The big difference is that USDA’s new estimate of beginning stocks had dropped by 646 million bushels from December to May. In other words, the only number of the big three in supply that was thought to be firm was just revised down by 36%. One can probably argue that the change is from several sources. Maybe the 2013 crop may not have been as large as estimated, or maybe the usage was higher than expected. No doubt quantity demanded did increase with the lower prices, but it is fundamentally questionable if the demand curve had really moved that much in roughly four months. It is worthwhile to note that if the Hedge-It model had used the later revised beginning stocks of 1.15 billion, it would have projected a median price of $4.42.
Looking on down the May WASDE column, the USDA numbers for demand are slightly lower than the Hedge-It numbers. Consequently, the Hedge-It median projection of $4.46 is slightly higher than the USDA estimates.
What have we learned? The WASDE report is a market mover. That is a reality that we have to live with and accept whether we think the estimates are correct or not. If all three of the major supply side factors are unknown, it is hard to put much faith in the projections. For me, it is important to watch for new fundamental information and have a system that will provide new price targets that can be used as windows for pricing decisions.
The way I see the table and chart being used is not to project a specific price because we are all projecting unknowns. Look at the picture the other way. If you have price targets, look at the demand curve to see what combination of supply factors have the potential to reach those targets. When the market reaches those targets without any obvious changes in fundamentals, it is time to take action. For this reason, I want the Hedge-It price projections to be on the high side so that sales are not triggered too early.
Posted by Keith D. Rogers on 31 May 2014.


