Serious marketing folks normally say the ending stocks which they will use to calculate ending stocks to use ratios. Theoretically that summarizes all of the data in the report into one piece of information with significant implications for price. Despite a logical basis and widespread use, stocks rations have a weak correlation with price which makes it a better directional price movement indicator than an indicator for projection of absolute price levels.
That would lead others to say the estimated average farm price for supply and demand equilibrium and sales targets is the most important. For many, the price estimate is the number that will be used in many different ways to triggered delayed or forward pricing of production. Estimate prices weigh heavily on the budget and lending discussions with most bankers. Another report was issued Friday, August 11, and only a small percent of farmers is likely to make new decisions based on the average price estimates because they believe the estimates will change (be raised) in future reports.
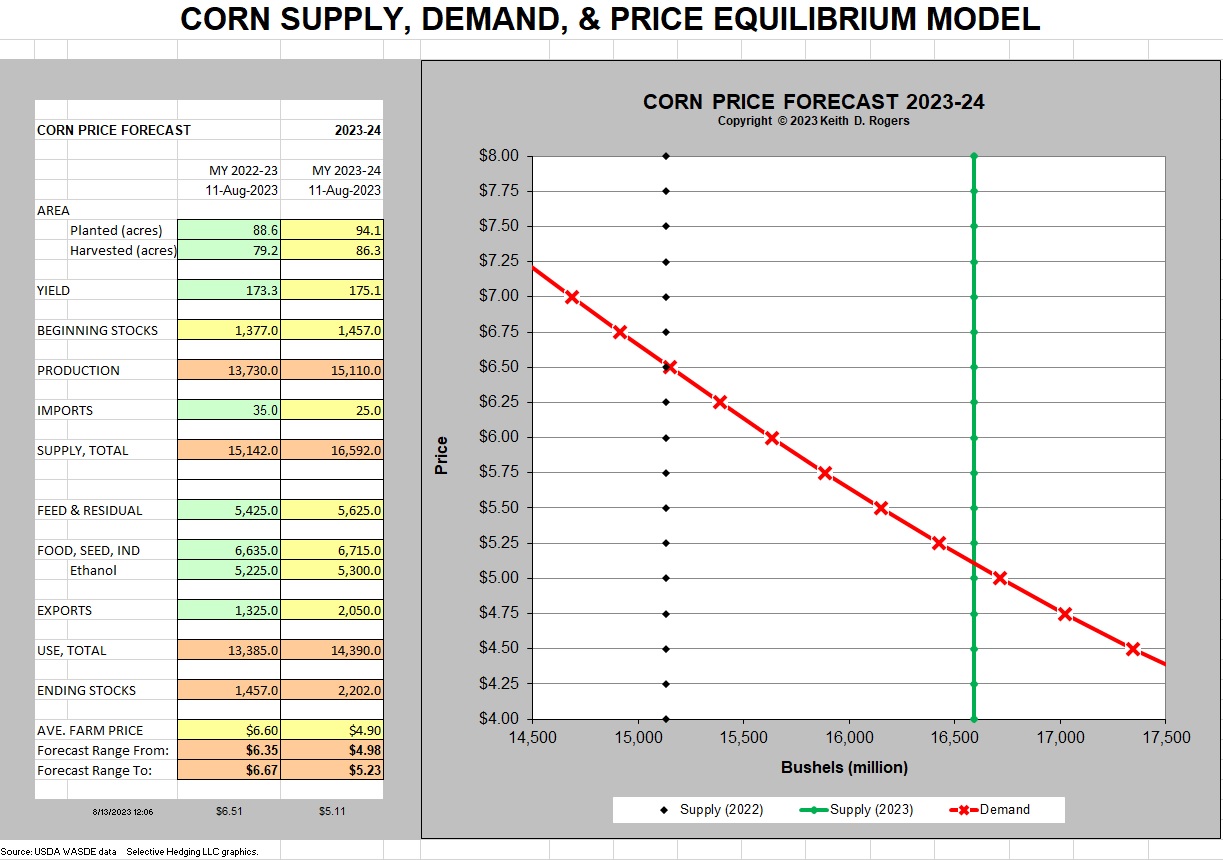
All eyes were focused on estimated production (yields and HA) in the August report and most certainly will be focused there again in September. Why? For all practical uses, production is now more or less a “fixed” vertical supply curve on the chart which will move right or left as more fields data becomes available. Fixed means that very little variation will be explained by price changes this late in the production season. Beginning stocks are essentially in the same category, subject to re-estimation but only slightly affected by price levels. Imports are so small and near to constant that they will contribute very little to total supply change. So, in reality, beginning stocks and production are the dominant variables in total supply and should be the major focus of each WASDE report.
Note that the bottom portion of the report is not called Demand, but rather Use, and that is significant. Feed, food, and exports all appear to be estimated quantities that will be purchased at an unspecified price, but until you see a demand curve, the price estimate lacks significant rigor. There is no obvious demand curve (series of paired prices and quantities purchased), yet, ending stocks are accepted as a simple residual of loosely estimated sales subtracted from supply estimates. Without a true demand curve with sales simultaneously determined with price, one would expect a very stable domestic portion of the demand/use, leaving exports as the most significant factor in the use section of the table as adjustments are made from month to month. More in depth analysis is required, but it appears that ending stocks are not just the residual of farmers dumping the harvest on the market when they get ready, but rather a “supply” factor or a “demand” factor based on farmers holding or releasing grain as a function of current and expected prices. The export component is known to be a function of U.S. prices, but can also be a shift in international demand which would just shift the demand left or right, leaving the domestic demand curve unchanged. More research is needed.
If the goal is to project price from the Supply and Use data, then the two most important pieces from the report are production that can shift the fixed supply curve right or left to slide up or down a stable domestic demand curve, and external political decisions to buy or sell U.S. product independent of the U.S. price and shift the demand curve right or left.
Below is a chart searching for price equilibrium using one line from the WASDE and a privately estimated proxy for demand. It’s not perfect, but is consistent. The chart estimates for average farm price are running about 10-20 cents or 2.0-4.0% above the USDA estimates. Note that the proxy demand curve embraces both 22-23 and 23-24 marketing years.
Posted by Keith D. Rogers on 13 August 2023