
EXECUTIVE SUMMARY: This is the first in a planned series of articles to review and summarize the historic performance of selected technical indicators for hedging livestock (cattle, hogs, and feeder cattle). The main objective of the series is to document the comparative performance of selected indicators in a standard format to help producers choose the ones that are most likely to assist in making effective and timely price risk management decisions. A template was created in a spreadsheet format using the last 300 days of the December Live Cattle contracts for 2008-2012. This article reviews simulated hedging decisions using nine moving average based indicators to calculate hedging gains and losses with predetermined hedging rules. The average contract closing price for the five contracts was $106.24. All nine indicators produced positive hedging gains (commissions and fees ignored), with average hedging gains ranging from $0.72 to $4.67 per hundredweight. Three of the indicators had no losing trades over all five contracts.
Last fall, I indicated that I was going to shift the focus of the Selective Hedging project to livestock. With the grains, the focus was on trend following indicators based on moving averages, partly because they are easier for beginners to understand. The selective hedging process based on quantitative technical indicators does not need to be complicated or a learning burden. Some fairly simple indicators produce some very useful results, and represent a great place to start if you are new to technical analysis. But in the bigger picture, it is useful to look at a longer list of indicators to refine price risk management strategies which will fit the goals of specific production units and commodities. Once you get your hands around the basic concepts, refining the hedging strategy can focus on maximizing price, minimizing number or size of losing trades, capping cumulative losses within a contract, and other similar goals.
I had also indicated that my previous experience hedging hogs lead me to expect that indicators in the oscillator group would likely be more effective than the trend following indicators. Preliminary evaluations of strategies to hedge cattle, hogs, and feeder cattle have been completed. This will be the first in a series of articles reporting on the results for nine levels for each of five different families or groups of indicators. Emphasis is on “preliminary” because the analysis involved the development of several new modules for the backtesting models, and the results have not been reviewed with the same detail as the earlier grain studies. That said, I think you will find the preliminary results interesting.
To make the transition from grains to livestock as smooth as possible, this first article in the series will start with the same nine technical indicators that were used in the grain studies. All nine indicators are in the moving average group, and would be considered as trend following indicators. With the grain studies, it was well documented that the results were significantly better when the basic moving average formulas were modified to give increased emphasis to the major trend. Similar results were produced with the livestock studies, so only the results for the modified formulas will be presented and discussed. For more details on the impact of the modifications, please refer back to the series of grain articles in the archives.
This article will discuss the results for a five year test period (2008-2012) for the December contract for Live Cattle on the Chicago Mercantile Exchange. The contract is for 40,000 pounds and is quoted in dollars per hundredweight. For each contract, the last 300 days were used for the analysis. At the top of the Modified Moving Average Crossover table, the contracts are listed in the first column (LC is for Live Cattle, Z is for December, and 08 is for 2008). The Hedging Gain/Loss Per Contract is the total gain or loss in dollars per hundredweight ($23.42 for LCZ08 using MA5 and MA17). 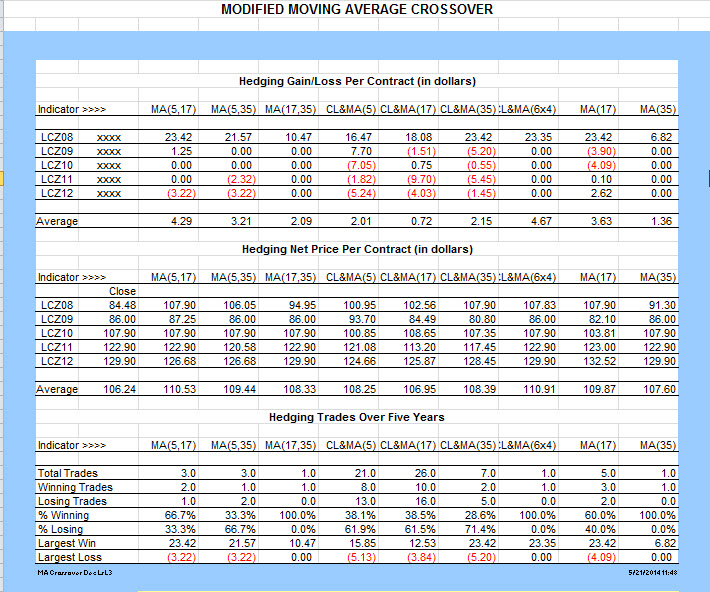 It is clear that the hedging process worked very well for the LCZ08 contract, with five of the nine indicators capturing more than $20.00 per hundredweight. Seven of the nine indicators produced those results with no losing trades, and the other two had only one small losing trade each. If the indicators produced this well for all of the contracts, most producers would not need to look much farther. Unfortunately, the high rate of success with the LCZ08 contract turns out to be a problem for the rest of the analysis, as will be discussed later.
In contrast to the LCZ08 contract, only two sets of indicators produced hedging gains of more than $1.25 for any of the nine indicators for the other four years in the base study period. Fifteen sets actually produced hedging losses for the year. Sixteen of the indicator sets made no trades during the test period.
Taken alone, failure to have a gain in the hedging account is not necessarily bad; having a loss is. The object of the hedging process is to transfer the price risk to a third party when the price trend is down. If the price trend is actually up, the producer does NOT need to have price protection is place. In fact, a loss in the account indicates that protection was in place when the trend was actually up. If this happens consistently, the hedging strategy needs to be reviewed carefully to determine if there are flaws in the design or execution. On the other hand, if the price trend is up, no protection is needed, and no gains will be generated in the hedging account. Therefore, having no trades can either suggest that the strategy is not effective or that the trend of the underlying data is actually up for this period.
A quick look at the five contracts provides some insight into what should be expected. LCZ08 rallied early and then turned down, with a close very near the bottom of the 300 day range. Obviously price protection was needed, and the technical indicators successfully provided signals when the trend turned down. LCZ09 rallied in the first few days of the 300 day range, turned down, and then rallied back to the close. This pattern created the opportunity for the CL&MA(5) indicator to capture $7.70 gain. LCZ10 rallied most of the year and closed at the contract high; thus, there was little need for price protection or opportunity for hedging gain. LCZ11 put in a low in the first few days of the contract, and then rallied throughout most of the year; again, little opportunity for a hedging gain. LCZ12 opened and closed at nearly the same price, and traded in a relatively tight range. With these insights, the results could be anticipated. In fact, the data set is excellent for trying to find a set of technical indicator that would be expected to work well across multiple market conditions.
The search engine that was used to evaluate alternative parameter sets is designed to find the highest average hedging gain unless other conditions are imposed. If the results from LCZ08 were not so dominant, a different set of parameters may have been found to provide more consistent price protection over multiple years. This should sound a warning not to jump to conclusions without reviewing the data and results carefully.
The middle of the table has the closing price for each contract in the second column, and then the resulting hedged price (ignoring commissions, fees, interest, etc.) for each indicator in the next nine columns. With the average closing price for the five contracts of $106.24, the hedging gains of $4.29 and $4.67 represent a gain of less than five percent. While the average prices from $106.95 to $110.91 may be higher than some producers actually received, the hedging gains are quite low by hedging standards. Again, with caution, if the price trend was up, one should not expect gain in the hedging account. The gain from proper management of the price risk, and not having price protection in place, would accrue to the cash position.
Readers are reminded that these are preliminary results, but that I did not expect the moving average indicators to work as well for livestock as for the grains. Readers are also reminded that the results are only for the December contract for Live Cattle, and for only one five year test period. The results may be different for other contract months, or for the Lean Hogs and Feeder Cattle.
The Hedging Trades section of the table has been changed slightly from the earlier grain tables. The changes were made to facilitate modules which were added to the search engine to further refine the evaluation process. The Trades numbers are total trades for all five contracts for all five years of the test period, and NOT the average number of trades as reported for the grains. The largest winning and losing trades are the single largest winning or losing trades across all contracts. For example, the $5.20 loss with CL&MA(35) is the largest loss in five years. It happens to be the only trade for LCZ09. The cumulative losses of $5.45 for the LCZ11 contract are the sum of individual losses, but with no loss larger than the $5.20 reported for LCZ09. The largest single losing trade for LCZ11 was $3.55.
Three of the indicators (MA(17,35), CL&MA(6×4), & MA(35)) produced no losing trades for the five year test period, but it should be noted that all three indicators only produced one sell signal in five years. While those signals were very effective for the LCZ08 contract, it allowed the LCZ08 contract to dominate the parameter evaluation process.
Perhaps, what this points out is how important it is to understand the implications of specific hedging goals and the potential unintended consequences of those particular goals. Additional modules were added to the search engine so that the hedging goals could be modified. Specifically, without much thought, the obvious goal would be to maximize net price over time. The consequence of that goal is what we see in the Live Cattle table.
A quick review of the table sheds some light on several issues. Four of the indicators produced losing trades more than 60 percent of the time. Two indicators produced losing trades of more than $5.00 per hundredweight, or more than a $2,000 loss per contract. Three indicators produced cumulative losses for the year of more than $5.00, with two years reaching $7.05 and $9.70 per hundredweight.
The number and size of these losses may exceed the tolerance or margin resources for some producers. With the additional new modules, the hedging goals can be redefined to maximize net price subject to limits on total losses, size of individual losses, caps on cumulative losses, etc. The impact of these modified goals is striking.
In general, if you cap the number or size of losses, you tend to reduce the maximum net price that can be achieved. For that observation, I am pleased that the system works the way it should – to the risks, go the rewards. However, giving up some small hedging gains may provide the opportunity to avoid some significant losing trades. These are tradeoffs that each producer must evaluate based on their overall price risk management plan and financial situation.
Since this is a learning site, I am not going to press on to attempt to identify “best” indicators for Live Cattle at this time. The definition of “best” is very subjective and unique to each management team. The main focus of this article is to provide preliminary results on how effective the moving average indicators have been for hedging Dec Live Cattle. The secondary point is to focus attention on factors which can significantly distort the selection of a “best” indicator, such as the dominance of a specific contract in a test period, the size and number of losing trades, cumulative losses, etc.
While the preliminary evaluations are finished for four more families of indicators, it may be easier to follow the threads if we continue with the moving average indicators for Lean Hogs and Feeder Cattle before we move on to new families of indicators. Watch for the next article to evaluating the use of moving averages for Lean Hogs.
As always, comments and questions are welcome. The easiest way is to Reply to the post on the Discussion Group page relating to Dec Cattle – Moving Averages.
Posted by Keith D. Rogers on 22 May 2014.


