
One, I wanted to make a point that it is often possible to find one technical indicator and set of parameters that can be applied across several commodities. Two, for those of you that are developing your own spreadsheet format, the bottom two numbers in the upper left corner of the charts will give you the values for a cross check (5 day is red, 35 day is blue). Now to the reason for an alert. Again, I remind you that I can’t decide which indicator will work best for you. But, if you are following the MA(5,35) indicator, there are some reasons to watch closely for the next few days. Questions or comments are welcome and encouraged. Reply to the email announcement directly or create a new message using the Contact Us page. Posted by Keith D. Rogers on 20 May 2013. Corn first. Both the 5 & 35 day averages (530.45 & 538.70) were headed south on Friday, not leaving much hope for a near term rally. Thinking ahead to what will move the 5 day average, it is all about today’s close compared to the close 5 days ago. Note that the closes for 3, 4, and 5 day ago are all in the $5.30-5.40 range, so that moving the average up will require closes above $5.40 to make significant changes.
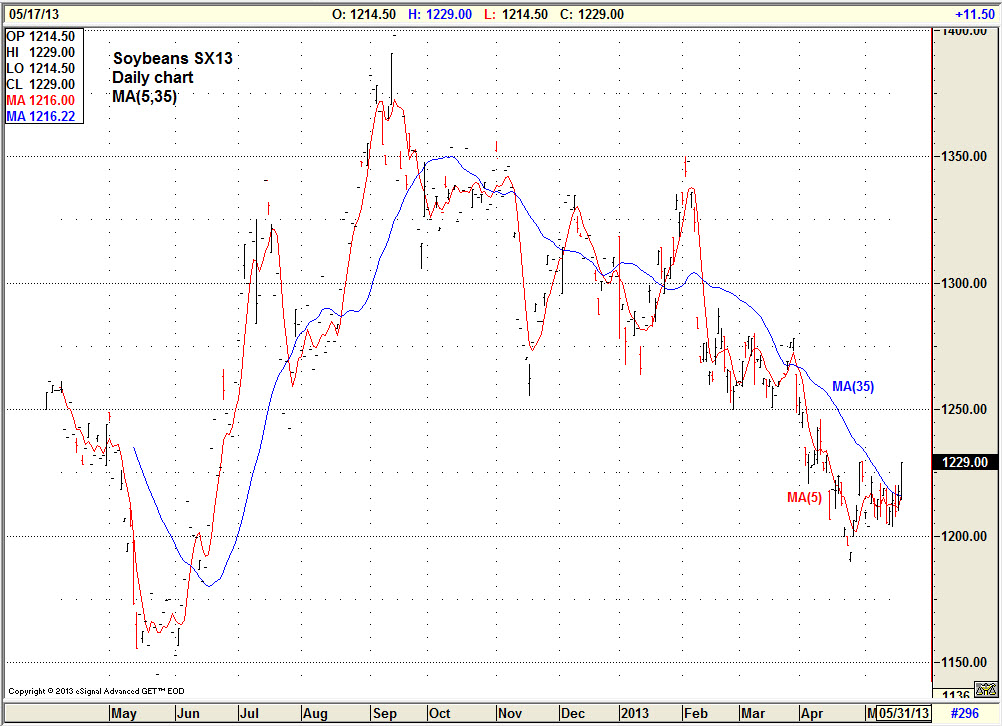
Soybeans next. The 5 day average (1216.00) is a fraction of a point below the 35 day average (1216.22), and is almost certain to cross up through the 35 day average with today’s close. In fact any close above 1203.87 will produce a 5 day average greater than 35 day average. Taken at face value, that would be a buy signal, time to lift hedges, or guidance to hold an open cash position. Will that be confirmed as we look ahead? Maybe. It would take a few more days of closes moving on up into the 1250 range before the 35 day average will make a bottom and turn up. If the real trend indicator is the 35 day average, then it will take a few days before there is confirmation that the trend has turned up. As the note at the top says, it is an alert to watch closely. Wheat next. The 5 day average (721.90) is below the 35 day average (730.40), and the price is falling. In wheat’s case, the 35 day average may be building a bottom, but prices are going to have to pull back up into the 730 range and above to stop the downward pressure on the average. This chart provides more encouragement than the other two that a bottom is in the making.
Counter


