
Executive Summary: This is the first in a new series of articles to look at the performance of a larger array of corn marketing strategies by updating an earlier study covering 1979/80-1983/84. A strategy based on equal monthly sales and a strategy based on seasonal price pattern both performed better for the 2008/09-2012/13 period than for the earlier period. The fact that the average monthly price in the 79-83 study did not exceed the mid point of the price range in any year, and it did exceed the mid point of the price range in every year in the 08-12 period, suggests that there was a different price pattern and bias in the two studies. The bias may be more important in understanding the performance of other strategies which will be discussed in forthcoming articles.
This is the first in a new series of articles to partially update a study and report for the Illinois Corn Marketing Board in 1985 titled “Evaluation of Corn Marketing Strategies for Harvest Delivery of Corn at Selected Illinois Locations: 1979/80-1983/84″. The research was later extended in a second report to cover the 1984/85-1985/86 marketing years. The original studies included 18 strategies using cash, basis, and futures contracts, and were evaluated at three locations in Illinois. The focus of the research was to generate a consistent set of data which would compare performance of alternative marketing plans over several years.
Chapter 5 in the book Hedging Works: Myth or Reality? is devoted to discussing the results and implications of these earlier studies. A key conclusion in the reports and the book is that many of the traditional and popular approaches to pricing and risk management did not produce consistent or competitive results.
In an attempt to keep the articles in this series shorter, the content has been divided so that each article will focus on closely related strategies. This article will discuss a base strategy and two strategies which utilize seasonal price patterns.
It has been pointed out to me often that the industry and economy have had some major changes over the 25 years since the original research was conducted and reported. The implications are that the strategies that worked then may not be effective any longer. Yet, at the same time, the most common strategies that are recommended by many advisory services today are simple variations on two or three strategies that have been taught and used for decades. The obvious question is whether any of the previous results are still relevant in today’s environment when designing and implementing a price risk management program.
The earlier research was designed to compare basic issues in marketing and not to be dependant upon any particular price levels or behavior, but clearly certain strategies are bias toward a short supply situation while others are bias toward big crops. That can not be avoided, and should be considered carefully when selecting a marketing strategy. In any case, the question can be debated extensively in a vacuum, but can really only be answered in a meaningful way by updating the previous studies with objective and consistent data.
In support of the argument that there has been structural change, the average futures price for the middle of November has moved from just over $3.00 in the previous studies to a $5.29 average for the five years from 2008 through 2012. Cost of production has risen from the $3.00 range to the $4.50-$5.00 range. Genetics have changed. Yields have increased. Ethanol plants have sprung up everywhere. Livestock production has become more concentrated. The list of changes is well documented, but the question still is whether these changes have altered the performance of marketing and price risk strategies.
This is only a partial update of the earlier studies, meaning that only some of the original strategies have been updated. Several things were considered before making the decision to limit the updates. First and foremost, the original studies were funded by the Illinois Corn Marketing Board specifically to study the performance of strategies that related directly to Illinois farmers. Now the audience that SelectiveHedging.com is serving has viewers in several U.S. states, Canada, U.K., Germany, Austria, and Poland, and provides access to viewers in any state or anywhere around the world. In this context, it seemed much more useful to not orient the update to any specific location and maintain a broad base of application.
But actions have consequences! Without cash or basis bids for specific locations, the only strategies that are applicable across the board are the ones using futures contracts for pricing comparisons. Therefore, the list of strategies to be updated was reduced from 18 to 8 by eliminating the cash and basis contracts, and all of the reported prices in the updated table are futures prices rather than cash prices. This does not mean that producers using cash contracts will be unable to use the results. It just means that you will have to use basis bids for your area to adjust the futures prices back to local cash prices.
Another change in the update is that trading commissions have not been deducted, and interest charges for trading account maintenance have not been included in the costs or deducted from the futures price which is quoted. As an indication of more structural changes, interest rates have dropped dramatically, and numerous discount brokers now provide services. With brokerage fees as low as $15-20 for a round turn on 5,000 bushels, the charge of less than half a cent per bushel will usually be insignificant. Likewise, the interest charges will be minimal and should have little impact on the outcome of the strategies, especially if you are actually using cash contracts instead of futures contracts. Again, if you are concerned, you need to deduct your estimate of these charges from the reported prices. As you will see, it will have very little impact on the rank order of how the strategies perform.
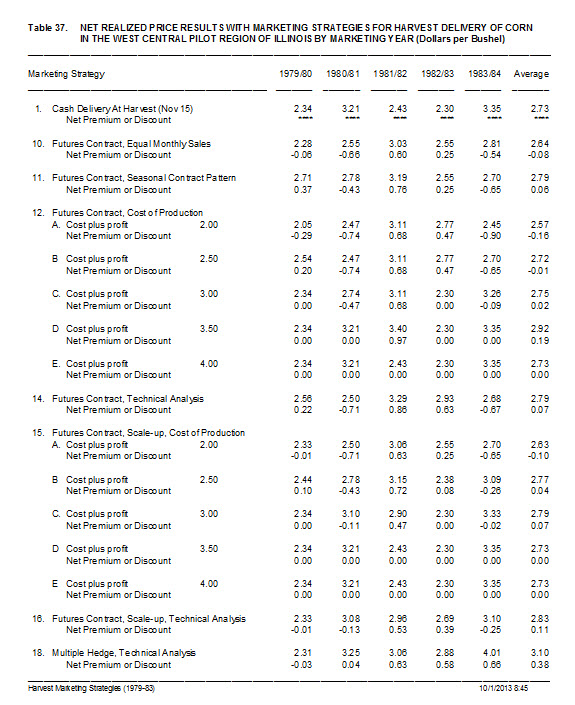 The first table is a reproduction of the futures based strategies from the earlier West Central Illinois (1979/80-1983/84) study. The numbering for the table and strategies has been retained from the original studies for the convenience of anyone who might be referencing those studies. The second table is the update for 2008/09-2012/13, again retaining the original numbering to make comparisons between the old study and the new study easier.
 Strategy 1 is essentially a “do nothing” strategy and is included to serve as the base reference point against which all of the other strategies in the study are compared. Harvest price has traditionally been considered to be the lowest price of the marketing year, so all marketing strategies should be expected to increase the average price and generate a premium for the strategy. In the old study, delivery was assumed to occur by the middle of November, and the cash prices are for the Thursday nearest to November 15. For the new study, delivery is the same, but the prices are the close of the December futures contract on the Thursday nearest to November 15. The five year cash average for the old study was $2.73, and the five year futures average for the new study is $5.29. These are the base numbers by which the other strategies will be evaluated.
Strategy 10 is a strategy structured to manage price risk by selling increments throughout the marketing year. The strategy assumes that the producer estimates the total amount of corn to be sold and prices equal amounts each month beginning in December and ending with a final sale in October. In the old study, the strategy may have been an effective price risk management tool, but the average price of $2.64 did not reach the level of the base strategy, resulting in a $0.08 discount per bushel. In the new study, the strategy was much more successful, and produced an average price of $5.77 with a premium of $0.48 over the base strategy.
This concept is a time honored strategy and certainly easy to implement. It will get the mathematical average price for the marketing year, and will minimize the risk of selling significant amounts at the lower end of the price range. However, it should be noted that while the strategy will generate the monthly average for the marketing year, it also restricts the producer to receiving no more than the average. In other words, the strategy provides no opportunity to take advantage of unique fundamental or technical information which might result in significantly higher prices. It also should be noted that the monthly average may or may not be above the mid point of the price range for the year, depending on the price pattern and market bias to the up side or down side.
For example, the mid points for the old study were $2.80, $3.36, $3.40, $2.62, and $3.17, respectively. The mid points for the new study were $5.58, $3.87, $4.58, $6.23, and $6.62. It is striking that equal monthly sales did not exceed the mid point for any of the five years in the original study, and did exceed the mid point for all five years in the new study. This suggests that there may be a different price pattern and bias throughout the season in the two studies.
Strategy 11 uses the seasonal average price pattern and assumes that the producer sells all of the corn in the month with the highest contract average. This strategy rests on one very critical assumption about seasonal price patterns, specifically that every season has a similar pattern. It does not provide a guarantee that you will avoid sales in the lower end of the price range, and it does not provide an opportunity to take advantage of fundamental or technical information.
The highest average month in the old study was July. Selling in July produced an average price of $2.79 and a small premium of $0.06 per bushel. In the current study, August is the highest average month. Selling in August produced an average price of $5.70 and a premium of $0.41 per bushel. As with Strategy 10, the shift from July to August for the highest monthly average suggests that there may be a different price pattern and bias in the two studies.
As noted in Strategy 10 above, there was a distinctly different price bias in the 2008-2012 study than in the 1979-83 study. A quick look at ending stock numbers may provide some insight. For the 79-83 study, ending stocks averaged 24.5% of total use. For the 08-12 study, ending stocks averaged 9.9% of total use, and fell every year from the high in 2008. One would expect the much tighter stock inventories to lead to more volatile markets. Since much of the volatility is yield and weather driven, the tighter stock situation in the 08-12 study period would create an expectation for a bias toward higher prices later in the marketing year.
A closer look at the price range relative to the general price level confirms the increased volatility. The average price range in the 79-83 study was 29.9% of the lowest price for the marketing year. The average price range in the 08-12 study jumped to 54.9%.
Where the market closes at the end of the marketing year relative to the price range over the year may also be an indicator of directional bias. For the 79-83 study, the average closing price in November was up 49.5% from the bottom of the range. In other words, the closing price was almost exactly in the middle of the price range for the year. The average closing price for the 08-12 study was 51.7% from the bottom of the range. However, it should be noted that the 09-12 average close is 64.7% up from the bottom of the range, and consistent with the tight inventory numbers. The numbers from both of the studies reject the hypothesis that one should always expect the lowest prices of the season at harvest. It wasn’t true 25 years ago, and it isn’t true today.
In summary, there are several points to be noted. 1) One should not assume that the lowest prices of the marketing year will occur at harvest time. 2) With all the changes in place, the incremental monthly sales and the seasonal high pricing strategies performed better in the 2008-12 study than in the 1979-83 study. 3) Equal monthly sales spread the price risk, but do not guarantee anything higher than the mathematical average for the year. That average may or may not be higher than the mid point price for the year, depending on the price pattern bias. 4) Sales based on the highest historical monthly average rests on a very critical assumption about the current year following a historical pattern when weather and other factors can shift the price bias significantly a in particular year. 5) Equal monthly sales will allow the producer to take advantage of market rally situations, but does not provide an opportunity to avoid falling markets. 6) Finally, both of these strategies would be expected to perform better than strategies that tend to initiate sales earlier in the marketing year.
Posted by Keith D. Rogers on 30 September 2013.


