
EXECUTIVE SUMMARY: This is the sixth in a planned series of articles reviewing and summarizing the estimated performance of selected trend indicators based on simple moving averages. Focus for articles four through six shifts to July contracts which are sometimes described as storage or old crop contracts. The main objective is to document the comparative performance of selected indicators to help producers choose the ones that are most likely to assist in making effective and timely price risk management decisions.
A template was created in a spreadsheet format using the last 300 days of the July Soybean contracts for 2008-2012. Formulas were written to simulate hedging decisions for nine moving average based indicators and to calculate the hedging gains or losses based on the predefined hedging rules. The average contract closing price was $13.47 for the five contracts.
Three of the nine indicators initially produced a positive average net hedging gain (commissions and fees ignored), resulting in a net hedged prices of $13.56 to $14.03. The trading rules were then modified to give greater emphasis to major trends, and all nine of the indicators produced average net hedged prices higher than the $13.47 base price, with a best of $14.51. Five modified indicators had no losing trades over the life of the five contracts.
I trust that you have read the first two articles (wheat and corn) which contained more detailed information about the backtesting approach and caveats about the data. If you have not read one of the previous articles, please do. The results reported here are based on the last 300 trading days of the contracts. While the results are believed to be as accurate as reasonably possible, they should be reviewed as research analysis results and not as “black box” trading systems.
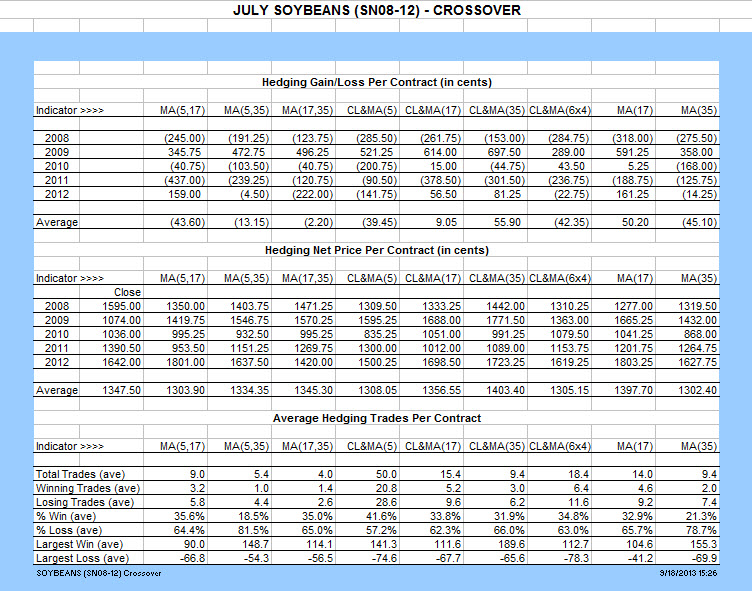 Let’s take a look at the estimated performance data now. Scanning across the bottom row of the Hedging Gain/Loss table, two of the nine indicators stand out for producing an average hedging gain of more than $0.50 per bushel. Those are CL&MA(35) and MA(17). As shown on the bottom line of the Hedging Net Price table, it follows that the two indicators produced average estimated net hedging prices of $14.03 and $13.97 compared to the average default closing price for the five years of $13.47.
The number of trades ranged from an average of 4.0 to 50.0. It may be noted that this number of trading signals is very similar to the number of signals that were reported for all of the contracts for wheat, corn, and soybeans in earlier articles.
The largest average winning trades ranged from a low of $0.90 to a high of $1.55 per bushel. The largest average losing trades ranged from a low of $0.41 to a high of $0.78. The choice of the best performance is personal and depends on multiple factors. Looking at the collective goals for hedging, there are tradeoffs between net price, percentage winning and losing trades, and size of losing trades. For many producers, there is no obvious best indicator in this set, but two the two which stand out for hedging price performance are CL&MA(35) and MA(17).
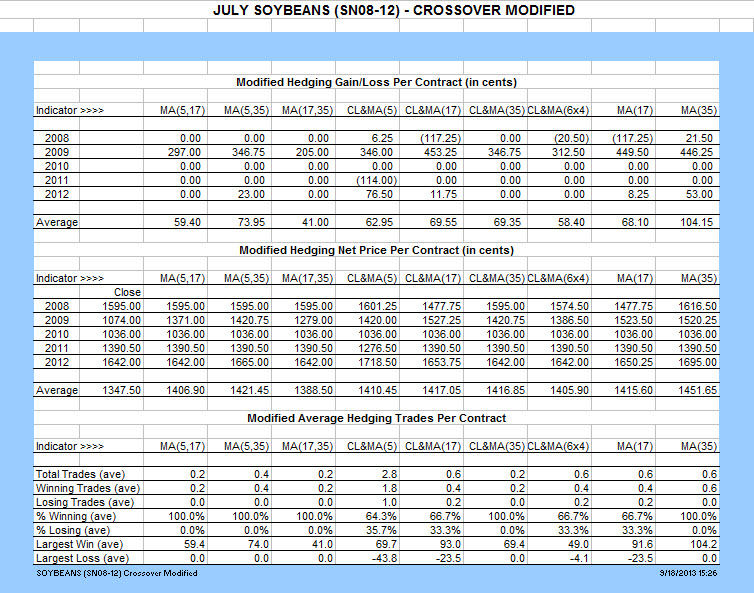 But before you put all of you eggs in one basket, let’s take a look at the second set of tables based on the modified trading rules. Scanning across the bottom row of the Modified Hedging Gain/Loss table, all of the indicators now produce an average hedging gain of at least $0.41 per bushel. Five of those do so with no losing trades over the life of the five contracts. Please refer to the table for details on the other indicators.
Comparing the results from the original rules with the results from the modified rules, four indicators increased the net realized price by a dollar per bushel or more. The increases ranged from $1.00 for CL&MA(6×4) to $1.49 for MA(35). Eight of the nine indicators produced an average net price of $14.00 or more with one above $14.50 (commissions and fees ignored).
The average number of sell signals dropped significantly to an average low of 0.2 and high of 2.8. Seven of the nine indicators produced only one, two, or three sell signal in five years, and five of the seven did so with NO LOSING trades on any of the five contracts. MA(5,35), MA(17,35), CL&MA(35), and MA(35) happen to be the same four indicators that had no losing trades for December corn and November soybeans. Two of the four had no losing trades for December wheat, and four had no losing trades for July wheat as well. Keep the consistency in mind as you try to focus in to narrow down the list of indicators you might settle on for use across several commodities.
Wait, it gets better! Three of the five indicators which had no losing trades and have been the most consistent all gave only one sell signal per year or kept an open position to the end of the contract. For a pure hedger who probably is using cash forward contracts, it doesn’t get much better. Perhaps one can find an indicator that would produce a higher price with no losing trades, but that would be the only improvement. Again, be reminded that past performance is no guarantee of future success, but it certainly does attract attention.
The average size of winning trades decreased with the modified trading rules, as did the size of the losing trades. The largest average win with the modified rules ranged from a low of $0.41 to a high of $1.04 per bushel. The largest average loss with the new rules ranged from zero to $0.43.
As stated earlier, there are plus and minus points to various indicators, and not everyone will choose the same one. Looking at the list of nine indicators, there are some differences. The estimated price range from $13.88 to $14.51 is relatively small over the five years and considering the volatility in the soybean complex. Based on the net hedging gain and no losing trades, MA(5,17), MA(5,35), CL&MA(35), and MA(35) appear to stand out for their performance.
The logical extension of this study for selective hedging would be to examine the charts to identify rallies and corrections deemed worthy of an exit and entry in the market, and then to focus on finding trading strategies and parameters that would provide buy and sell signals as close to those points as possible.
Again, there is a lot of new material here for your consideration, and I hope I have been able to focus on issues you will want to consider when selecting a trend following indicator for a pure or selective hedge to help manage price risk. Take the time to digest the material and don’t hesitate to send questions if you need help getting your hands around any of this.
Remember that all of the above analysis was accomplished by dropping a data set for the contracts into a spreadsheet, and then programming in the trading rules and accounting formulas to keep track of the gains and losses. In keeping with the overall goal of the website, these are all things you can do at your own desk.
Posted by Keith D. Rogers on 18 September 2013


